Plot summary visualizations for the differential expression results
Source:R/diff_expression.R
plot_de_summary.Rdplot_de_summary() creates summary visualizations for the differential expression results.
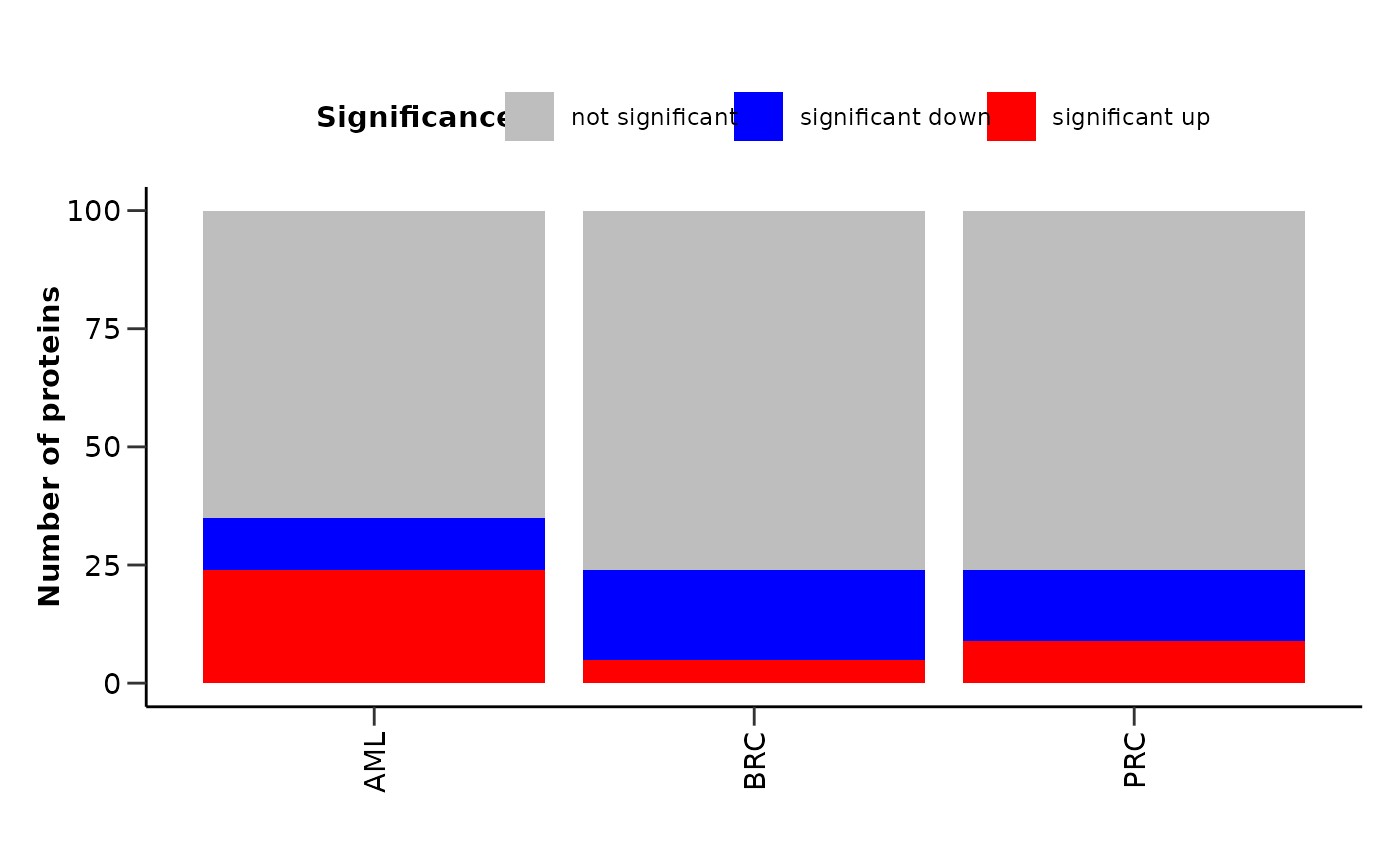
It plots a barplot with the number of significant proteins for each disease.
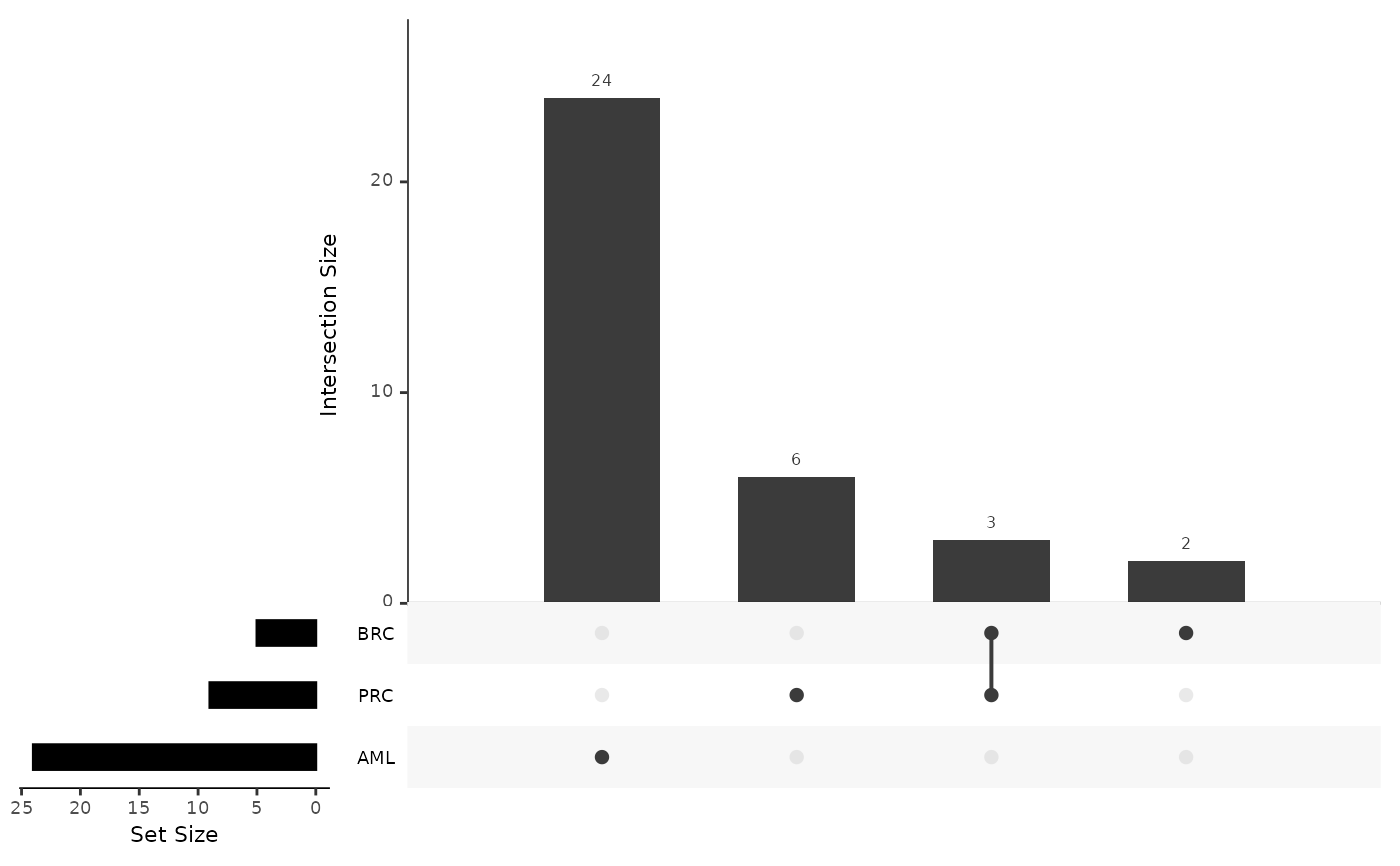
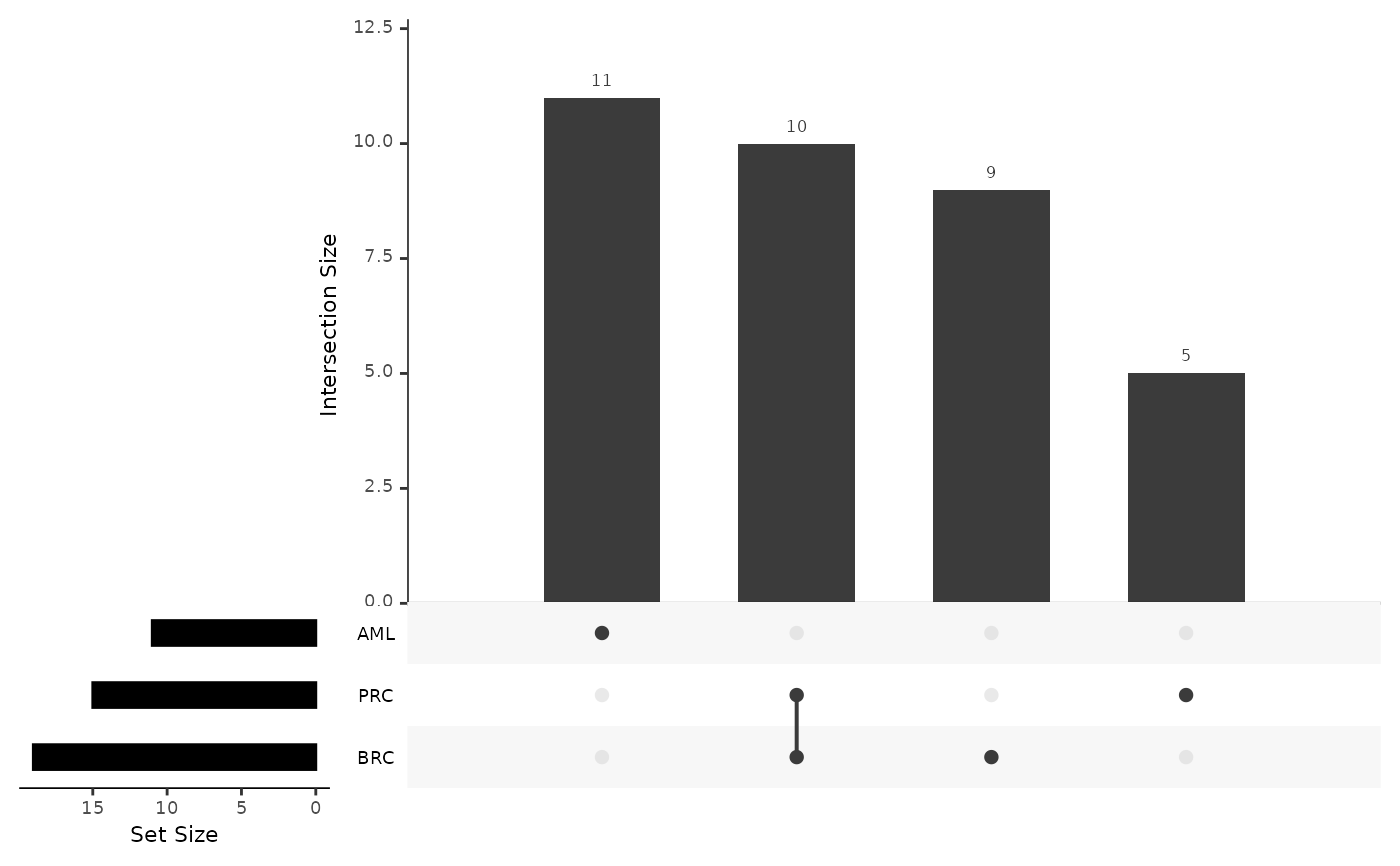
It also creates upset plots both for the significant up and down regulated proteins for each disease.
Usage
plot_de_summary(
  de_results,
  disease_palette = NULL,
  diff_exp_palette = "diff_exp",
  verbose = TRUE
)
Arguments
- de_results
A list of differential expression results.
- disease_palette
The color palette for the disease. If it is a character, it should be one of the palettes from
get_hpa_palettes(). Default is NULL.- diff_exp_palette
The color palette for the differential expression. If it is a character, it should be one of the palettes from
get_hpa_palettes(). Default is "diff_exp".- verbose
If the function should print the different sets of significant proteins for each disease. Default is TRUE.
Value
A list containing the following plots:
de_barplot: A barplot with the number of significant proteins for each disease.
upset_plot_up: An upset plot with the significant up regulated proteins for each disease.
upset_plot_down: An upset plot with the significant down regulated proteins for each disease.
proteins_df_up: A tibble with the significant up regulated proteins for each combination of diseases.
proteins_df_down: A tibble with the significant down regulated proteins for each combination of diseases.
proteins_list_up: A list with the significant up regulated proteins for each combination of diseases.
proteins_list_down: A list with the significant down regulated proteins for each combination of diseases.
Examples
# Run differential expression analysis for 3 different cases
de_results_aml <- do_limma(example_data,
example_metadata,
case = "AML",
control = c("BRC", "PRC"),
wide = FALSE,
only_female = "BRC",
only_male = "PRC")
#> Comparing AML with BRC, PRC.
#> Warning: 436 rows were removed because they contain NAs in Disease or Sex, Age!
de_results_brc <- do_limma(example_data,
example_metadata,
case = "BRC",
control = c("AML", "PRC"),
wide = FALSE,
only_female = "BRC",
only_male = "PRC")
#> Comparing BRC with AML, PRC.
#> Warning: 293 rows were removed because they contain NAs in Disease or Sex, Age!
de_results_prc <- do_limma(example_data,
example_metadata,
case = "PRC",
control = c("AML", "BRC"),
wide = FALSE,
only_female = "BRC",
only_male = "PRC")
#> Comparing PRC with AML, BRC.
#> Warning: 143 rows were removed because they contain NAs in Disease or Sex, Age!
# Combine the results
res <- list("AML" = de_results_aml,
"BRC" = de_results_brc,
"PRC" = de_results_prc)
# Plot summary visualizations
plot_de_summary(res)
#> [1] "AML" "PRC" "BRC"
#> # A tibble: 35 × 3
#> `Shared in` `up/down` Assay
#> <chr> <chr> <chr>
#> 1 AML up ABL1
#> 2 PRC up ACAN
#> 3 AML up ACE2
#> 4 AML up ACTA2
#> 5 AML up ADA
#> 6 AML up ADA2
#> 7 BRC up ADAMTS13
#> 8 BRC&PRC up ADAMTS8
#> 9 AML up ADGRG1
#> 10 BRC&PRC up ADGRG2
#> # ℹ 25 more rows
#> # A tibble: 35 × 3
#> `Shared in` `up/down` Assay
#> <chr> <chr> <chr>
#> 1 BRC up ABL1
#> 2 AML up ACAN
#> 3 BRC up ACE2
#> 4 BRC&PRC up ACTA2
#> 5 BRC&PRC up ADA
#> 6 BRC up ADA2
#> 7 AML up ADAMTS13
#> 8 AML up ADAMTS8
#> 9 BRC up ADGRE5
#> 10 BRC&PRC up ADGRG1
#> # ℹ 25 more rows
#> $de_barplot
 #>
#> $upset_plot_up
#>
#> $upset_plot_up
 #>
#> $upset_plot_down
#>
#> $upset_plot_down
 #>
#> $proteins_df_up
#> # A tibble: 35 × 3
#> `Shared in` `up/down` Assay
#> <chr> <chr> <chr>
#> 1 AML up ABL1
#> 2 PRC up ACAN
#> 3 AML up ACE2
#> 4 AML up ACTA2
#> 5 AML up ADA
#> 6 AML up ADA2
#> 7 BRC up ADAMTS13
#> 8 BRC&PRC up ADAMTS8
#> 9 AML up ADGRG1
#> 10 BRC&PRC up ADGRG2
#> # ℹ 25 more rows
#>
#> $proteins_df_down
#> # A tibble: 35 × 3
#> `Shared in` `up/down` Assay
#> <chr> <chr> <chr>
#> 1 BRC up ABL1
#> 2 AML up ACAN
#> 3 BRC up ACE2
#> 4 BRC&PRC up ACTA2
#> 5 BRC&PRC up ADA
#> 6 BRC up ADA2
#> 7 AML up ADAMTS13
#> 8 AML up ADAMTS8
#> 9 BRC up ADGRE5
#> 10 BRC&PRC up ADGRG1
#> # ℹ 25 more rows
#>
#> $proteins_list_up
#> $proteins_list_up$AML
#> [1] "ADA" "APEX1" "AZU1" "APBB1IP" "ANGPT2" "ARTN"
#> [7] "ADGRG1" "ACTA2" "AHCY" "AGRP" "ARID4B" "B4GALT1"
#> [13] "ABL1" "ADM" "ATP6V1F" "ATP6AP2" "ANGPTL4" "AMFR"
#> [19] "AREG" "ACE2" "ATF2" "ADA2" "AIF1" "ARHGAP25"
#>
#> $proteins_list_up$`BRC&PRC`
#> [1] "ANGPT1" "ADGRG2" "ADAMTS8"
#>
#> $proteins_list_up$BRC
#> [1] "ANGPT1" "ADGRG2" "ADAMTS8" "ADAMTS13" "ART3"
#>
#> $proteins_list_up$PRC
#> [1] "ATG4A" "ADAMTS8" "ANGPT1" "APOM" "ADGRG2" "ALDH1A1" "AMY2B"
#> [8] "ALPP" "ACAN"
#>
#>
#> $proteins_list_down
#> $proteins_list_down$AML
#> [1] "ANGPT1" "ADAMTS8" "ADGRG2" "APOM" "ATG4A" "ADAMTS13"
#> [7] "ARHGEF12" "APP" "ALPP" "ACAN" "ANGPTL7"
#>
#> $proteins_list_down$`BRC&PRC`
#> [1] "ADA" "AZU1" "APEX1" "APBB1IP" "ARTN" "ANGPT2" "ACTA2"
#> [8] "AGRP" "ARID4B" "ADGRG1"
#>
#> $proteins_list_down$BRC
#> [1] "ADA" "AZU1" "APEX1" "APBB1IP" "AHCY" "ARTN"
#> [7] "ANGPT2" "ACTA2" "B4GALT1" "ABL1" "AGRP" "ARID4B"
#> [13] "ACE2" "ADA2" "ADGRG1" "ARHGAP25" "ATF2" "ARSA"
#> [19] "ADGRE5"
#>
#> $proteins_list_down$PRC
#> [1] "ADGRG1" "APEX1" "ADA" "AZU1" "ARTN" "ANGPT2" "ATP6AP2"
#> [8] "AGRP" "APBB1IP" "ADM" "AREG" "ARID4B" "ATP6V1F" "ANGPTL4"
#> [15] "ACTA2"
#>
#>
#>
#> $proteins_df_up
#> # A tibble: 35 × 3
#> `Shared in` `up/down` Assay
#> <chr> <chr> <chr>
#> 1 AML up ABL1
#> 2 PRC up ACAN
#> 3 AML up ACE2
#> 4 AML up ACTA2
#> 5 AML up ADA
#> 6 AML up ADA2
#> 7 BRC up ADAMTS13
#> 8 BRC&PRC up ADAMTS8
#> 9 AML up ADGRG1
#> 10 BRC&PRC up ADGRG2
#> # ℹ 25 more rows
#>
#> $proteins_df_down
#> # A tibble: 35 × 3
#> `Shared in` `up/down` Assay
#> <chr> <chr> <chr>
#> 1 BRC up ABL1
#> 2 AML up ACAN
#> 3 BRC up ACE2
#> 4 BRC&PRC up ACTA2
#> 5 BRC&PRC up ADA
#> 6 BRC up ADA2
#> 7 AML up ADAMTS13
#> 8 AML up ADAMTS8
#> 9 BRC up ADGRE5
#> 10 BRC&PRC up ADGRG1
#> # ℹ 25 more rows
#>
#> $proteins_list_up
#> $proteins_list_up$AML
#> [1] "ADA" "APEX1" "AZU1" "APBB1IP" "ANGPT2" "ARTN"
#> [7] "ADGRG1" "ACTA2" "AHCY" "AGRP" "ARID4B" "B4GALT1"
#> [13] "ABL1" "ADM" "ATP6V1F" "ATP6AP2" "ANGPTL4" "AMFR"
#> [19] "AREG" "ACE2" "ATF2" "ADA2" "AIF1" "ARHGAP25"
#>
#> $proteins_list_up$`BRC&PRC`
#> [1] "ANGPT1" "ADGRG2" "ADAMTS8"
#>
#> $proteins_list_up$BRC
#> [1] "ANGPT1" "ADGRG2" "ADAMTS8" "ADAMTS13" "ART3"
#>
#> $proteins_list_up$PRC
#> [1] "ATG4A" "ADAMTS8" "ANGPT1" "APOM" "ADGRG2" "ALDH1A1" "AMY2B"
#> [8] "ALPP" "ACAN"
#>
#>
#> $proteins_list_down
#> $proteins_list_down$AML
#> [1] "ANGPT1" "ADAMTS8" "ADGRG2" "APOM" "ATG4A" "ADAMTS13"
#> [7] "ARHGEF12" "APP" "ALPP" "ACAN" "ANGPTL7"
#>
#> $proteins_list_down$`BRC&PRC`
#> [1] "ADA" "AZU1" "APEX1" "APBB1IP" "ARTN" "ANGPT2" "ACTA2"
#> [8] "AGRP" "ARID4B" "ADGRG1"
#>
#> $proteins_list_down$BRC
#> [1] "ADA" "AZU1" "APEX1" "APBB1IP" "AHCY" "ARTN"
#> [7] "ANGPT2" "ACTA2" "B4GALT1" "ABL1" "AGRP" "ARID4B"
#> [13] "ACE2" "ADA2" "ADGRG1" "ARHGAP25" "ATF2" "ARSA"
#> [19] "ADGRE5"
#>
#> $proteins_list_down$PRC
#> [1] "ADGRG1" "APEX1" "ADA" "AZU1" "ARTN" "ANGPT2" "ATP6AP2"
#> [8] "AGRP" "APBB1IP" "ADM" "AREG" "ARID4B" "ATP6V1F" "ANGPTL4"
#> [15] "ACTA2"
#>
#>