do_limma() performs differential expression analysis using limma package.
It can correct the results for metadata columns like Sex, Age, or BMI.
The output tibble includes the logFC, p-values, as well as the FDR adjusted p-values.
The function removes the NAs from the columns that are used to correct for.
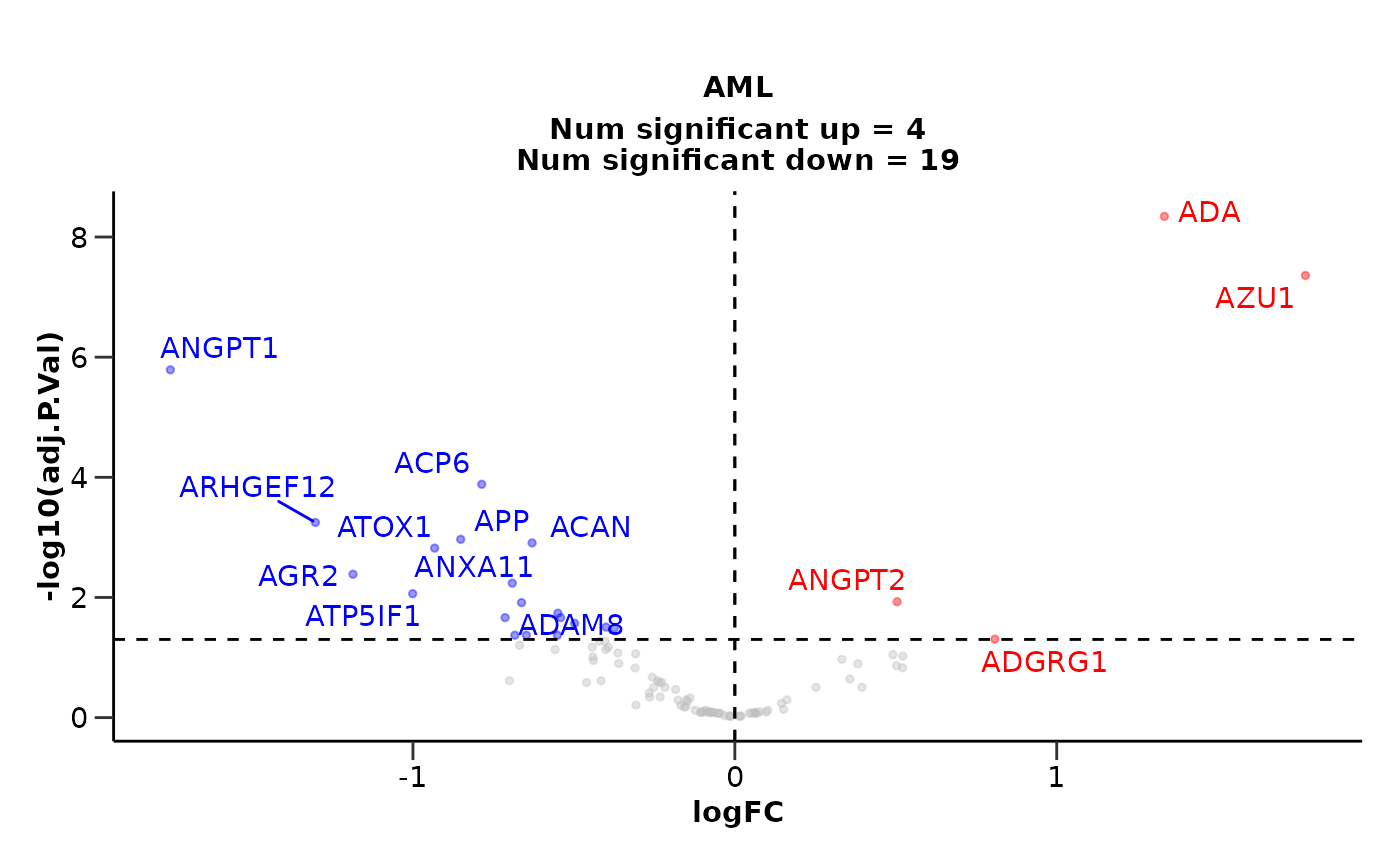
It can generate and save volcano plots.
Usage
do_limma(
  olink_data,
  metadata,
  variable = "Disease",
  case,
  control,
  correct = c("Sex", "Age"),
  correct_type = c("factor", "numeric"),
  wide = TRUE,
  only_female = NULL,
  only_male = NULL,
  volcano = TRUE,
  pval_lim = 0.05,
  logfc_lim = 0,
  top_up_prot = 40,
  top_down_prot = 10,
  palette = "diff_exp",
  report_nproteins = TRUE,
  user_defined_proteins = NULL,
  subtitle = NULL,
  save = FALSE
)
Arguments
- olink_data
A tibble with the Olink data in wide format.
- metadata
A tibble with the metadata.
- variable
The variable of interest that includes the case and control groups.
- case
The case group.
- control
The control groups.
- correct
The variables to correct the results with. Default c("Sex", "Age").
- correct_type
The type of the variables to correct the results with. Default c("factor", "numeric", "numeric").
- wide
If the data is in wide format. Default is TRUE.
- only_female
The female specific diseases. Default is NULL.
- only_male
The male specific diseases. Default is NULL.
- volcano
Generate volcano plots. Default is TRUE.
- pval_lim
The p-value limit of significance. Default is 0.05.
- logfc_lim
The logFC limit of significance. Default is 0.
- top_up_prot
The number of top up regulated proteins to label on the plot. Default is 40.
- top_down_prot
The number of top down regulated proteins to label on the plot. Default is 10.
- palette
The color palette for the plot. If it is a character, it should be one of the palettes from
get_hpa_palettes(). Default is "diff_exp".- report_nproteins
If the number of significant proteins should be reported in the subtitle. Default is TRUE.
- user_defined_proteins
A list with the user defined proteins to label on the plot. Default is NULL.
- subtitle
The subtitle of the plot or NULL for no subtitle.
- save
Save the volcano plots. Default is FALSE.
Value
A list with the differential expression results and volcano plots.
de_results: A list with the differential expression results.
volcano_plots: A list with the volcano plots.
Details
For sex-specific diseases, there will be no correction for Sex.
This is performed automatically by the function. It will also filter out
rows with NA values in any of the columns that are used for correction,
either the variable or in correct. The user_defined_proteins overrides
the top_up_prot and top_down_prot arguments.
Examples
de_results <- do_limma(example_data,
                       example_metadata,
                       case = "AML",
                       control = c("CLL", "MYEL"),
                       wide = FALSE)
#> Comparing AML with CLL, MYEL.
#> Warning: 450 rows were removed because they contain NAs in Disease or Sex, Age!

# Results for AML
de_results$de_results
#> # A tibble: 100 × 11
#>    Assay     logFC   CI.L   CI.R AveExpr     t  P.Value adj.P.Val      B Disease
#>    <chr>     <dbl>  <dbl>  <dbl>   <dbl> <dbl>    <dbl>     <dbl>  <dbl> <chr>
#>  1 ADA       1.33   0.966  1.70    1.46   7.16 4.54e-11   4.54e-9 14.7   AML
#>  2 AZU1      1.77   1.24   2.31    0.592  6.58 8.73e-10   4.37e-8 11.8   AML
#>  3 ANGPT1   -1.75  -2.35  -1.15    1.26  -5.79 4.87e- 8   1.62e-6  7.95  AML
#>  4 ACP6     -0.786 -1.11  -0.459   1.36  -4.75 5.22e- 6   1.31e-4  3.43  AML
#>  5 ARHGEF12 -1.30  -1.90  -0.709   3.38  -4.34 2.82e- 5   5.64e-4  1.83  AML
#>  6 APP      -0.852 -1.26  -0.443   0.959 -4.13 6.46e- 5   1.08e-3  1.03  AML
#>  7 ACAN     -0.630 -0.938 -0.322   0.596 -4.05 8.66e- 5   1.24e-3  0.737 AML
#>  8 ATOX1    -0.933 -1.40  -0.467   3.23  -3.96 1.21e- 4   1.51e-3  0.445 AML
#>  9 AGR2     -1.19  -1.83  -0.545   1.78  -3.66 3.70e- 4   4.11e-3 -0.618 AML
#> 10 ANXA11   -0.692 -1.08  -0.304   0.973 -3.53 5.78e- 4   5.78e-3 -1.02  AML
#> # ℹ 90 more rows
#> # ℹ 1 more variable: sig <chr>

# Volcano plot for AML
de_results$volcano_plot

