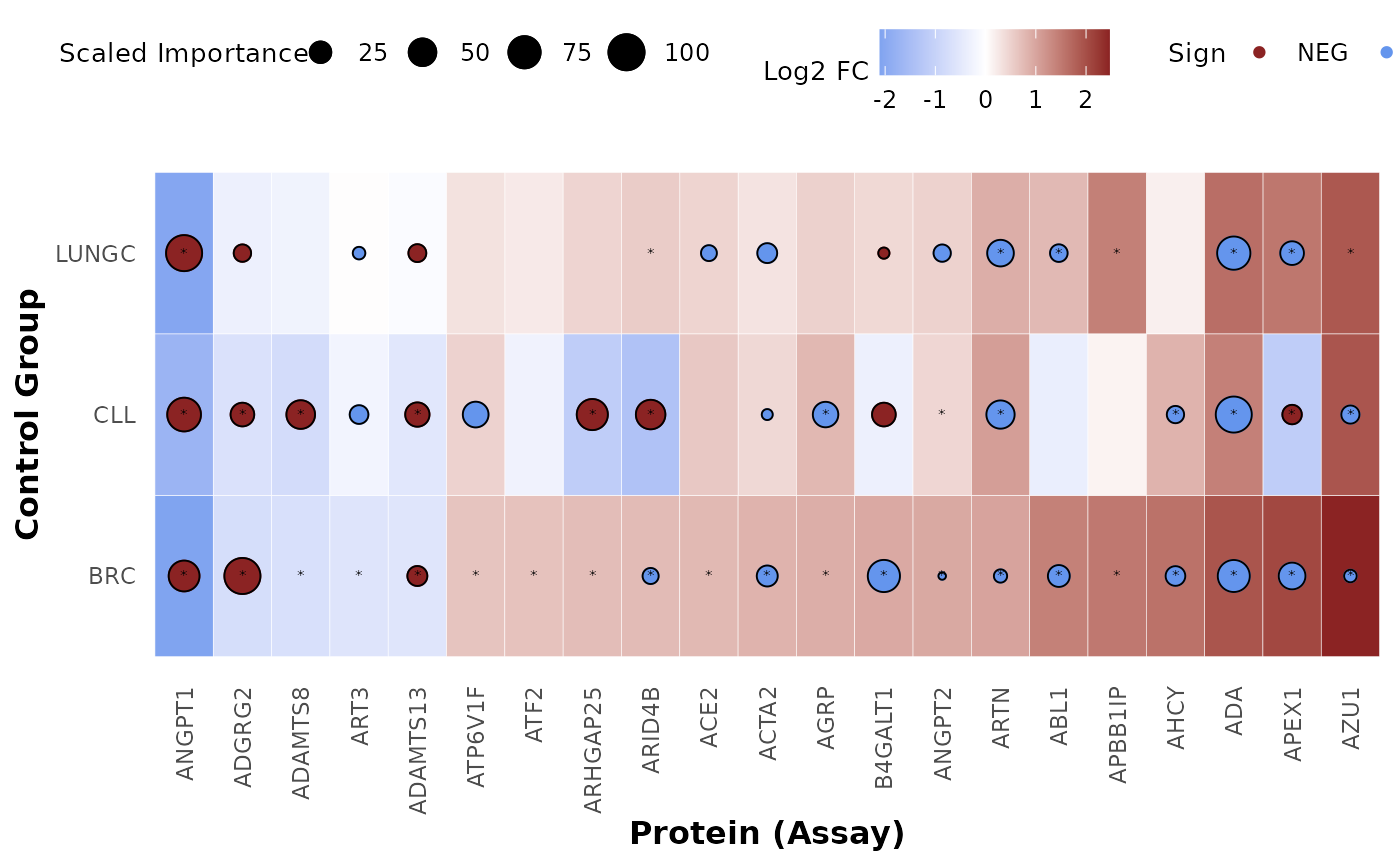
Plot a summary heatmap of the combined differential expression and classification models results
Source:R/visualize.R
plot_biomarkers_summary_heatmap.Rdplot_biomarkers_summary_heatmap plots a summary heatmap of the combined differential
expression and classification models results. The heatmap shows the log2 fold change
and adjusted p-value of the differential expression results, and the scaled importance
and sign of the classification models results. The heatmap is ordered and the selected
assays are based on the specified control group.
Usage
plot_biomarkers_summary_heatmap(
  de_results,
  ml_results,
  order_by = NULL,
  pval_lim = 0.05,
  logfc_lim = 0
)
Arguments
- de_results
A list of differential expression results.
- ml_results
A list of classification models results.
- order_by
The control group to order the heatmap.
- pval_lim
The p-value limit to filter the differential expression results of the
order_bygroup.- logfc_lim
The log2 fold change limit to filter the differential expression results of the
order_bygroup.
Value
The summary heatmap of the combined differential expression and classification models results.
Details
It is very important the de_results and ml_results are in the same order and in the right format (see examples).
Examples
# Prepare differential expression results
de_results_amlbrc <- do_limma(example_data,
                              example_metadata,
                              case = "AML",
                              control = c("BRC"),
                              wide = FALSE,
                              only_female = "BRC")
#> Comparing AML with BRC.
#> Warning: 486 rows were removed because they contain NAs in Disease or Sex, Age!

de_results_amlcll <- do_limma(example_data,
                              example_metadata,
                              case = "AML",
                              control = c("CLL"),
                              wide = FALSE,
                              only_female = "BRC")
#> Comparing AML with CLL.
#> Warning: 488 rows were removed because they contain NAs in Disease or Sex, Age!

de_results_amllungc <- do_limma(example_data,
                                example_metadata,
                                case = "AML",
                                control = c("LUNGC"),
                                wide = FALSE,
                                only_female = "BRC")
#> Comparing AML with LUNGC.
#> Warning: 486 rows were removed because they contain NAs in Disease or Sex, Age!

# Combine the results
res_de <- list("BRC" = de_results_amlbrc,
               "CLL" = de_results_amlcll,
               "LUNGC" = de_results_amllungc)

res_amlbrc <- do_rreg(example_data,
                      example_metadata,
                      case = "AML",
                      type = 'elnet',
                      control = c("BRC"),
                      wide = FALSE,
                      only_female = "BRC",
                      cv_sets = 2,
                      grid_size = 1,
                      ncores = 1)
#> Joining with `by = join_by(DAid)`
#> Sets and groups are ready. Model fitting is starting...
#> Classification model for AML as case is starting...
#> Warning: Due to the small size of the grid, a Latin hypercube design will be used.

res_amlcll <- do_rreg(example_data,
                      example_metadata,
                      case = "AML",
                      type = 'elnet',
                      control = c("CLL"),
                      wide = FALSE,
                      only_female = "BRC",
                      cv_sets = 2,
                      grid_size = 1,
                      ncores = 1)
#> Joining with `by = join_by(DAid)`
#> Sets and groups are ready. Model fitting is starting...
#> Classification model for AML as case is starting...
#> Warning: Due to the small size of the grid, a Latin hypercube design will be used.

res_amllungc <- do_rreg(example_data,
                        example_metadata,
                        case = "AML",
                        control = c("LUNGC"),
                        type = 'elnet',
                        wide = FALSE,
                        only_female = "BRC",
                        cv_sets = 2,
                        grid_size = 1,
                        ncores = 1)
#> Joining with `by = join_by(DAid)`
#> Sets and groups are ready. Model fitting is starting...
#> Classification model for AML as case is starting...
#> Warning: Due to the small size of the grid, a Latin hypercube design will be used.

# Combine the results
res_ml <- list("BRC" = res_amlbrc,
               "CLL" = res_amlcll,
               "LUNGC" = res_amllungc)

# Create the summary heatmap
plot_biomarkers_summary_heatmap(res_de, res_ml, order_by = "BRC")
#> Warning: Removed 22 rows containing missing values or values outside the scale range
#> (`geom_point()`).
#> Warning: Removed 22 rows containing missing values or values outside the scale range
#> (`geom_point()`).
