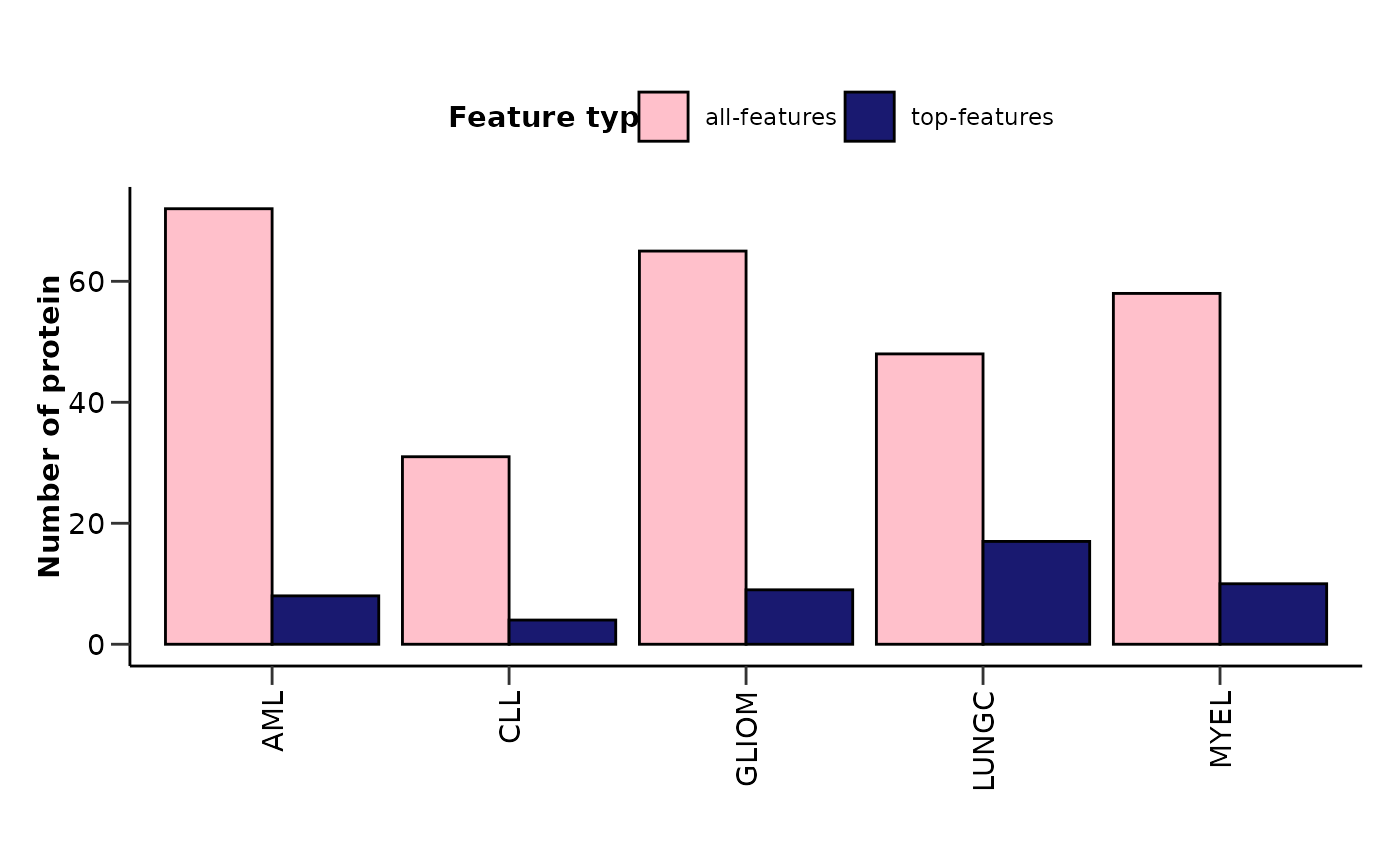
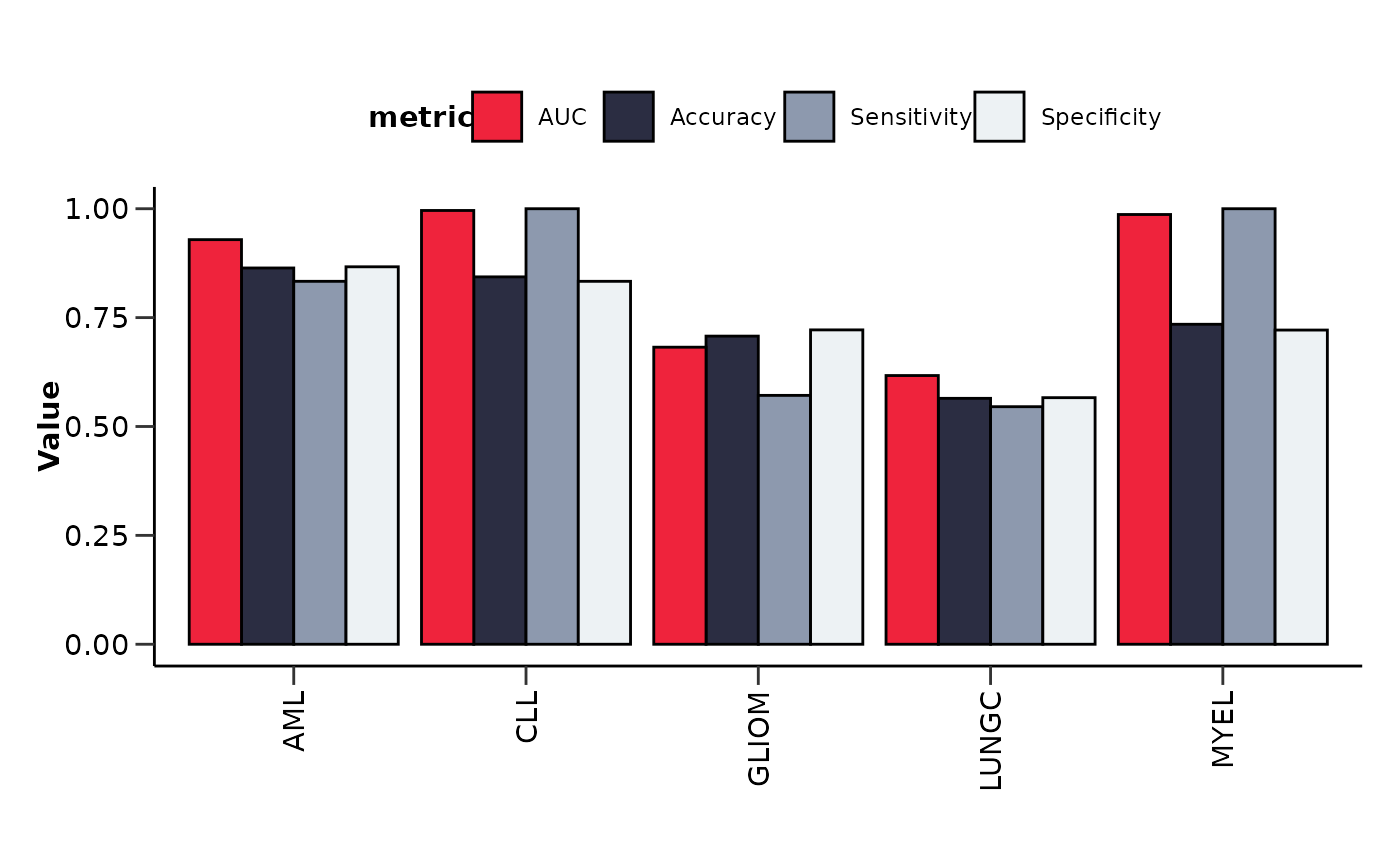
hd_plot_model_summary() plots the number of features and the number of top
features (feature importance > user defined threshold) for each disease in a barplot.
It also plots the upset plot of the top or all features, as well as a summary line plot
of the model performance metrics.
Usage
hd_plot_model_summary(
  model_results,
  importance = 0.5,
  class_palette = NULL,
  upset_top_features = FALSE
)
Arguments
- model_results
A list of binary classification model results. It should be a list of objects created by
hd_model_rreg(),hd_model_rf()orhd_model_lr()with the classes as names. See the examples for more details.- importance
The importance threshold to consider a feature as top. Default is 0.5.
- class_palette
The color palette for the classes. If it is a character, it should be one of the palettes from
hd_palettes(). Default is NULL.- upset_top_features
Whether to plot the upset plot for the top features or all features. Default is FALSE (all features).
Examples
# Initialize an HDAnalyzeR object with only a subset of the predictors
hd_object <- hd_initialize(example_data, example_metadata)
# Split the data into training and test sets
hd_split <- hd_split_data(hd_object, variable = "Disease")
#> Warning: Too little data to stratify.
#> • Resampling will be unstratified.
# Run the regularized regression model pipeline
model_results_aml <- hd_model_rreg(hd_split,
variable = "Disease",
case = "AML",
grid_size = 2,
cv_sets = 2,
verbose = FALSE)
#> The groups in the train set are balanced. If you do not want to balance the groups, set `balance_groups = FALSE`.
model_results_cll <- hd_model_rreg(hd_split,
variable = "Disease",
case = "CLL",
grid_size = 2,
cv_sets = 2,
verbose = FALSE)
#> The groups in the train set are balanced. If you do not want to balance the groups, set `balance_groups = FALSE`.
model_results_myel <- hd_model_rreg(hd_split,
variable = "Disease",
case = "MYEL",
grid_size = 2,
cv_sets = 2,
verbose = FALSE)
#> The groups in the train set are balanced. If you do not want to balance the groups, set `balance_groups = FALSE`.
model_results_lungc <- hd_model_rreg(hd_split,
variable = "Disease",
case = "LUNGC",
grid_size = 2,
cv_sets = 2,
verbose = FALSE)
#> The groups in the train set are balanced. If you do not want to balance the groups, set `balance_groups = FALSE`.
model_results_gliom <- hd_model_rreg(hd_split,
variable = "Disease",
case = "GLIOM",
grid_size = 2,
cv_sets = 2,
verbose = FALSE)
#> The groups in the train set are balanced. If you do not want to balance the groups, set `balance_groups = FALSE`.
res <- list("AML" = model_results_aml,
"LUNGC" = model_results_lungc,
"CLL" = model_results_cll,
"MYEL" = model_results_myel,
"GLIOM" = model_results_gliom)
# Plot summary visualizations
hd_plot_model_summary(res, class_palette = "cancers12")
#> $features_barplot
 #>
#> $metrics_barplot
#>
#> $metrics_barplot
 #>
#> $upset_plot_features
#>
#> $upset_plot_features
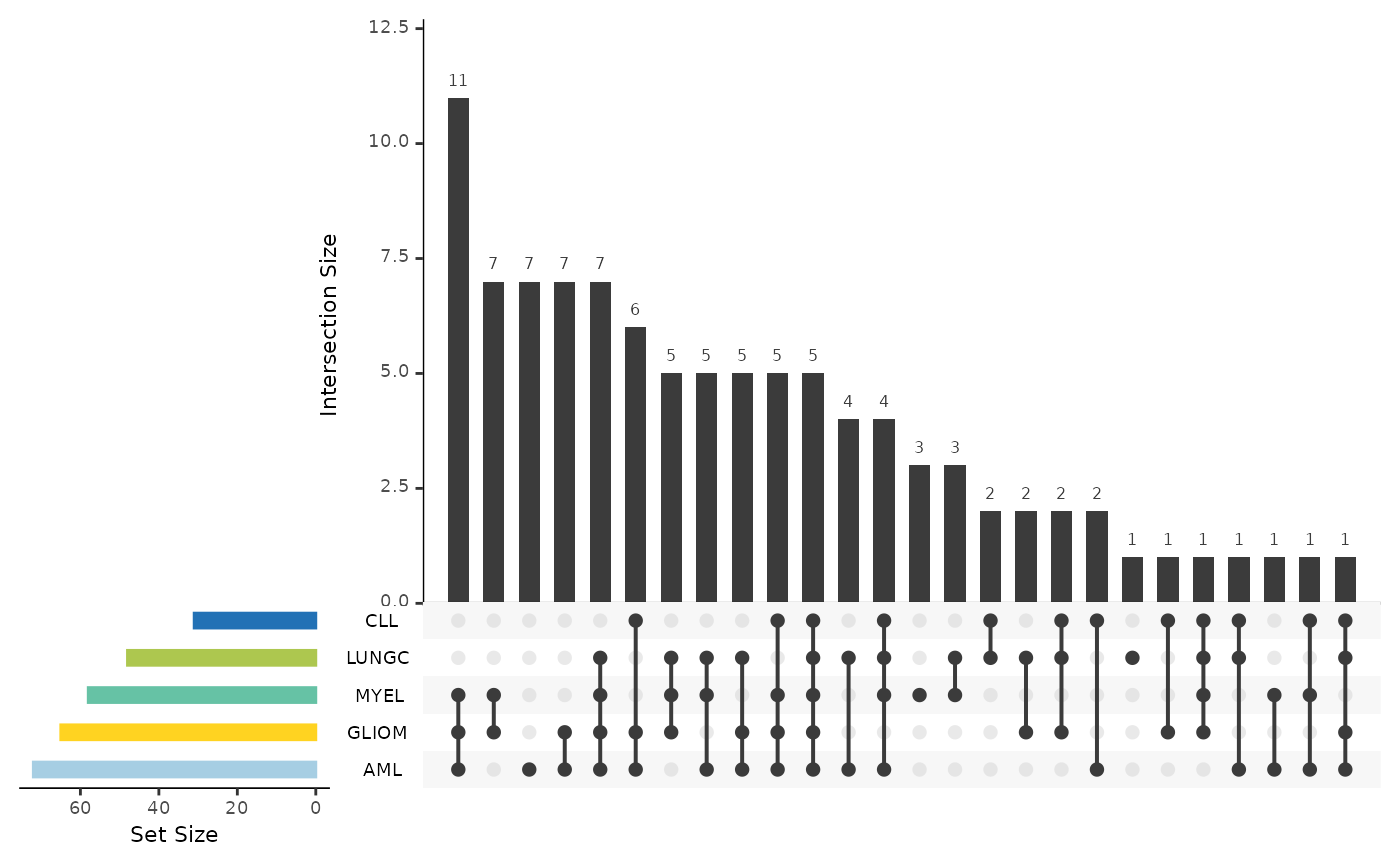 #>
#> $features_df
#> # A tibble: 100 × 3
#> Shared_in `up/down` Feature
#> <chr> <chr> <fct>
#> 1 AML&LUNGC&CLL&MYEL&GLIOM up ACAA1
#> 2 AML&LUNGC&CLL&MYEL&GLIOM up ACE2
#> 3 AML&LUNGC&CLL&MYEL&GLIOM up ACTN4
#> 4 AML&LUNGC&CLL&MYEL&GLIOM up ADA2
#> 5 AML&LUNGC&CLL&MYEL&GLIOM up ADAMTS15
#> 6 AML&LUNGC&CLL&MYEL&GLIOM up ADAMTS8
#> 7 AML&LUNGC&CLL&MYEL&GLIOM up ADGRE5
#> 8 AML&LUNGC&CLL&MYEL&GLIOM up ADM
#> 9 AML&LUNGC&CLL&MYEL&GLIOM up AGER
#> 10 AML&LUNGC&CLL&MYEL&GLIOM up AGR2
#> # ℹ 90 more rows
#>
#> $features_list
#> $features_list$`AML&LUNGC&CLL&MYEL&GLIOM`
#> [1] ANGPT1 ADGRG1 AMY2A ADAMTS16 ADA AHCY ADAM8
#> [8] AMIGO2 ANGPTL2 ALCAM APEX1 ADH4 AMFR AK1
#> [15] ABL1 ANPEP ATP6V1D AARSD1 ANKRD54 APOH ALDH1A1
#> [22] AXL APBB1IP ADGRE2 ACP6 ATG4A APOM ACAN
#> [29] ANXA11 AGR3 ARHGAP1 ADGRG2 ATXN10 APP AMBN
#> [36] AMBP ACP5 AGRN ADAM15 ADAMTS13 ARTN ANXA5
#> [43] ACTA2 ATOX1 APLP1 ARNT ACY1 ANXA4 ANG
#> [50] ATF2 AMN ANGPT2 ALDH3A1 ANGPTL7 ANGPTL3 AKR1B1
#> [57] AOC3 AGRP AZU1 ANXA3 B4GALT1 ADCYAP1R1 AKT3
#> [64] AGXT ARSB ATP5IF1 ARHGEF12 AKT1S1 ACOX1 ATP6V1F
#> [71] ADAM23 ARHGAP25 ACAA1 ACE2 ACTN4 ADA2 ADAMTS15
#> [78] ADAMTS8 ADGRE5 ADM AGER AGR2 AHSP AIF1
#> [85] AIFM1 AKR1C4 ALPP AMY2B ANGPTL1 ANGPTL4 ANXA10
#> [92] AOC1 AREG ARG1 ARID4B ARSA ART3 ATP5PO
#> [99] ATP6AP2 AXIN1
#> 100 Levels: ACAA1 ACE2 ACTN4 ADA2 ADAMTS15 ADAMTS8 ADGRE5 ADM AGER AGR2 ... ANGPT1
#>
#>
#>
#> $features_df
#> # A tibble: 100 × 3
#> Shared_in `up/down` Feature
#> <chr> <chr> <fct>
#> 1 AML&LUNGC&CLL&MYEL&GLIOM up ACAA1
#> 2 AML&LUNGC&CLL&MYEL&GLIOM up ACE2
#> 3 AML&LUNGC&CLL&MYEL&GLIOM up ACTN4
#> 4 AML&LUNGC&CLL&MYEL&GLIOM up ADA2
#> 5 AML&LUNGC&CLL&MYEL&GLIOM up ADAMTS15
#> 6 AML&LUNGC&CLL&MYEL&GLIOM up ADAMTS8
#> 7 AML&LUNGC&CLL&MYEL&GLIOM up ADGRE5
#> 8 AML&LUNGC&CLL&MYEL&GLIOM up ADM
#> 9 AML&LUNGC&CLL&MYEL&GLIOM up AGER
#> 10 AML&LUNGC&CLL&MYEL&GLIOM up AGR2
#> # ℹ 90 more rows
#>
#> $features_list
#> $features_list$`AML&LUNGC&CLL&MYEL&GLIOM`
#> [1] ANGPT1 ADGRG1 AMY2A ADAMTS16 ADA AHCY ADAM8
#> [8] AMIGO2 ANGPTL2 ALCAM APEX1 ADH4 AMFR AK1
#> [15] ABL1 ANPEP ATP6V1D AARSD1 ANKRD54 APOH ALDH1A1
#> [22] AXL APBB1IP ADGRE2 ACP6 ATG4A APOM ACAN
#> [29] ANXA11 AGR3 ARHGAP1 ADGRG2 ATXN10 APP AMBN
#> [36] AMBP ACP5 AGRN ADAM15 ADAMTS13 ARTN ANXA5
#> [43] ACTA2 ATOX1 APLP1 ARNT ACY1 ANXA4 ANG
#> [50] ATF2 AMN ANGPT2 ALDH3A1 ANGPTL7 ANGPTL3 AKR1B1
#> [57] AOC3 AGRP AZU1 ANXA3 B4GALT1 ADCYAP1R1 AKT3
#> [64] AGXT ARSB ATP5IF1 ARHGEF12 AKT1S1 ACOX1 ATP6V1F
#> [71] ADAM23 ARHGAP25 ACAA1 ACE2 ACTN4 ADA2 ADAMTS15
#> [78] ADAMTS8 ADGRE5 ADM AGER AGR2 AHSP AIF1
#> [85] AIFM1 AKR1C4 ALPP AMY2B ANGPTL1 ANGPTL4 ANXA10
#> [92] AOC1 AREG ARG1 ARID4B ARSA ART3 ATP5PO
#> [99] ATP6AP2 AXIN1
#> 100 Levels: ACAA1 ACE2 ACTN4 ADA2 ADAMTS15 ADAMTS8 ADGRE5 ADM AGER AGR2 ... ANGPT1
#>
#>