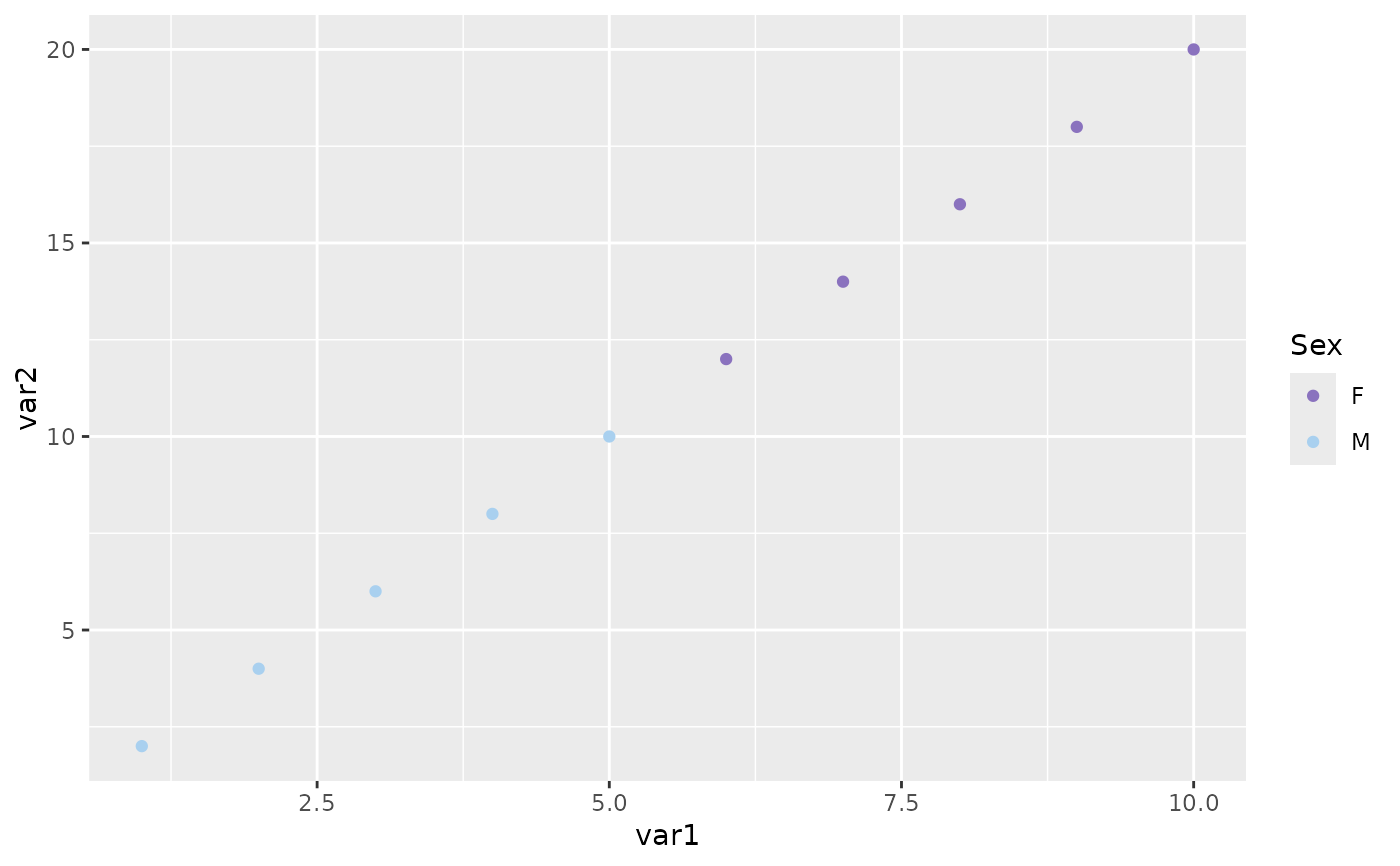
scale_color_hpa() creates a ggplot2 scale for color aesthetics using the color
palettes from the Human Protein Atlas (HPA) project.
Arguments
- palette
The name of the palette to use. It should be one of the palettes from
get_hpa_palettes().
Examples
# Create an example dataframe
data <- data.frame(
  var1 = 1:10,
  var2 = seq(2, 20, by = 2),
  Sex = rep(c("M", "F"), each = 5)
)

# Create a plot
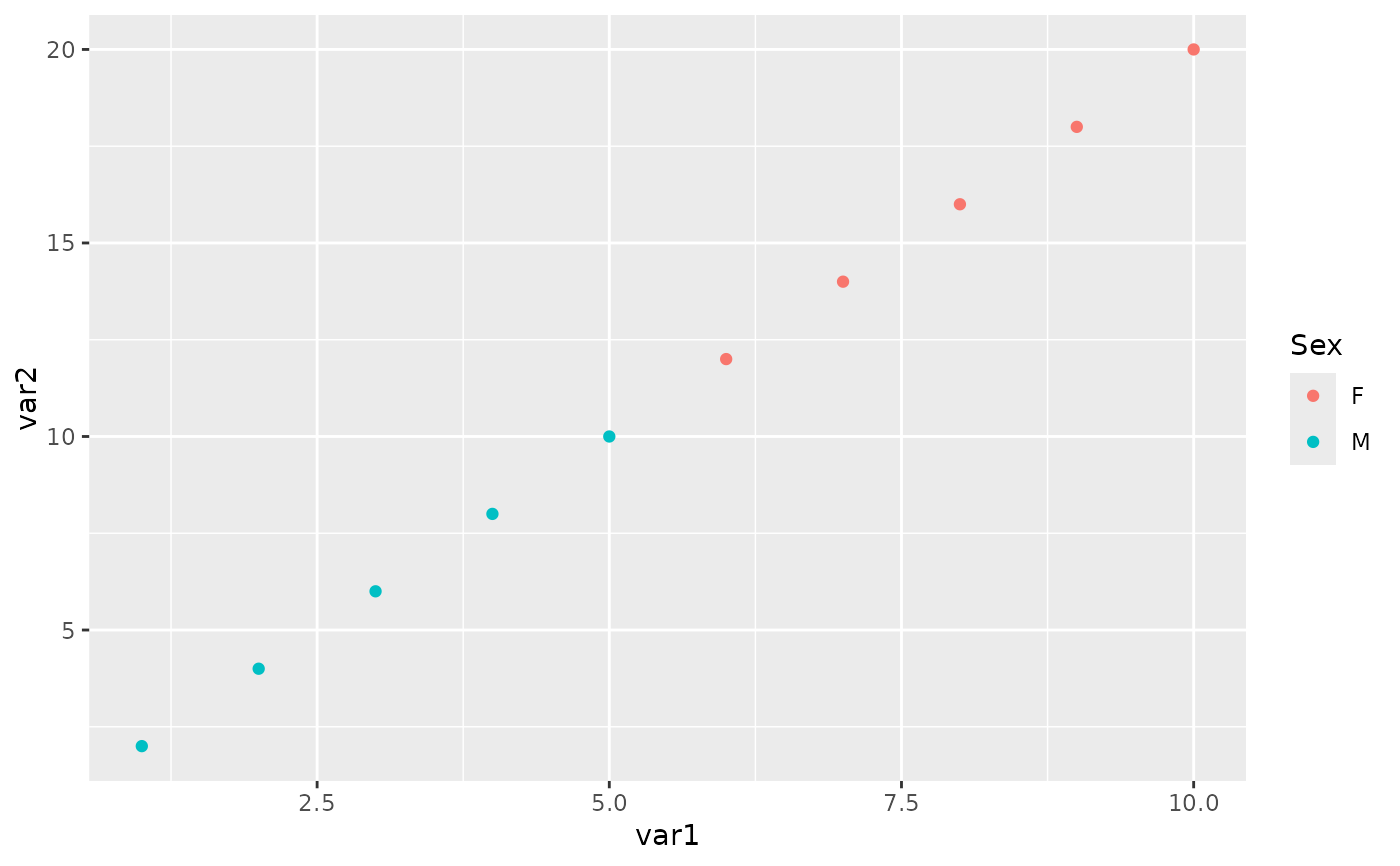
plot <- ggplot2::ggplot(data, ggplot2::aes(x = var1, y = var2, color = Sex)) +
  ggplot2::geom_point()
plot


# Add a custom palette
plot + scale_color_hpa("sex_hpa")

