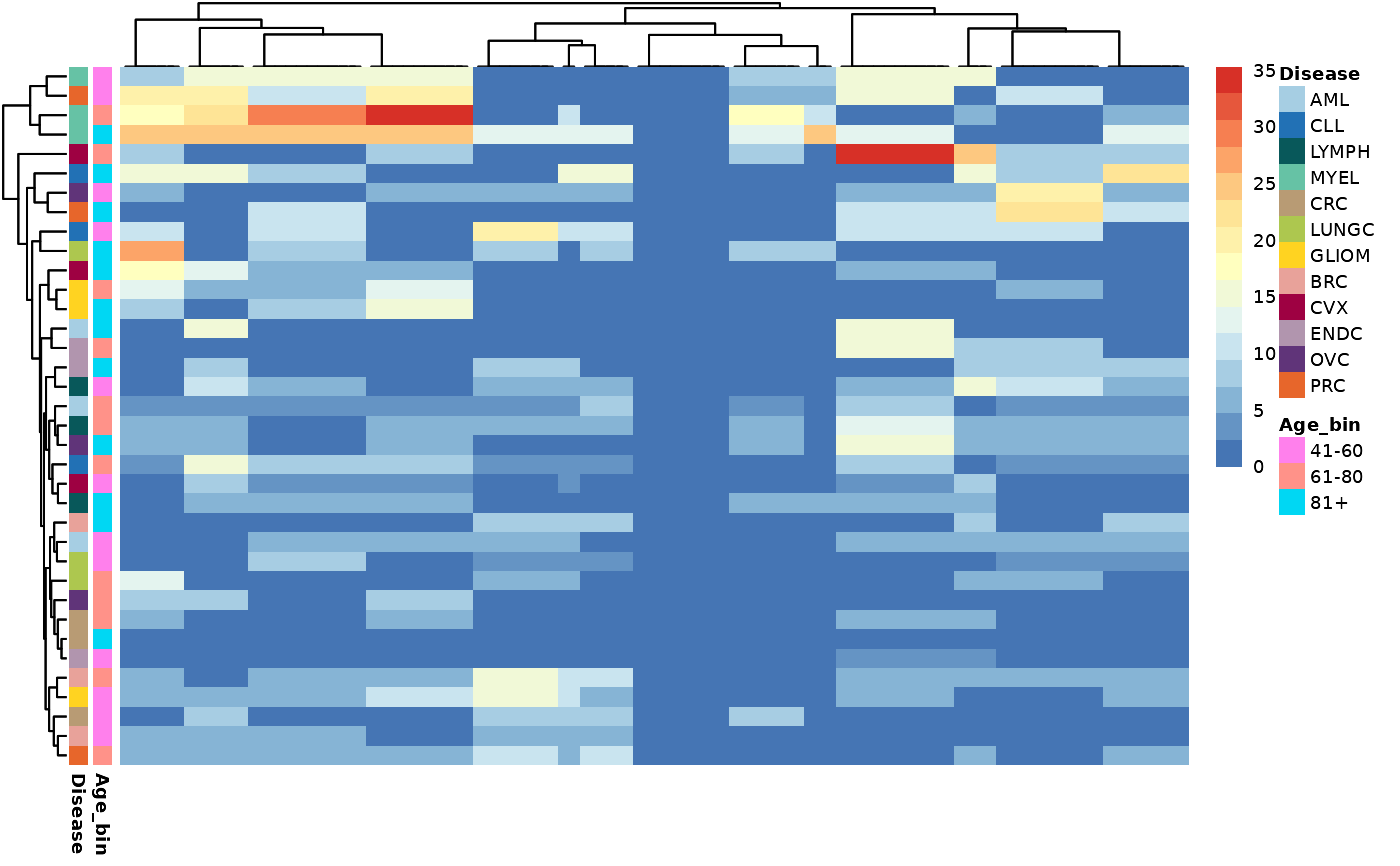
na_search() provides a summary of missing values in a dataset. It allows the user to
specify the metadata columns to include in the summary and the color palette to use for
the heatmap annotations.
Usage
na_search(
  olink_data,
  metadata,
  wide = TRUE,
  metadata_cols = NULL,
  palette = NULL,
  x_labels = FALSE,
  y_labels = FALSE,
  show_heatmap = TRUE
)
Arguments
- olink_data
The Olink dataset.
- metadata
The metadata dataset.
- wide
If TRUE, the data is in wide format.
- metadata_cols
The metadata columns to include in the summary.
- palette
The color palettes to use for the heatmap annotations (check examples bellow).
- x_labels
If TRUE, show x-axis labels.
- y_labels
If TRUE, show y-axis labels.
- show_heatmap
If TRUE, show the heatmap.
Details
When using continuous metadata variables, consider converted them to categorical by binning them into categories before passing them to the function. This will make the heatmap more informative and easier to interpret. Also when coloring annotations, the user can use custom palettes or the Human Protein Atlas (HPA) palettes. It is not required to provide a palette for all annotations, but when a palette is provided, it must be in correct format (check examples bellow).
Examples
# Use custom palettes for coloring annotations
palette = list(Sex = c(M = "blue", F = "pink"))
na_res <- na_search(example_data,
                    example_metadata,
                    wide = FALSE,
                    metadata_cols = c("Age", "Sex"),
                    palette = palette,
                    show_heatmap = FALSE)

# Use HPA palettes for coloring annotations
palette = list(Disease = get_hpa_palettes()$cancers12, Sex = get_hpa_palettes()$sex_hpa)
na_res <- na_search(example_data,
                    example_metadata,
                    wide = FALSE,
                    metadata_cols = c("Disease", "Sex"),
                    palette = palette,
                    show_heatmap = FALSE)

# Pre-bin a continuous variable
metadata <- example_metadata
metadata$Age_bin <- cut(metadata$Age,
                        breaks = c(0, 20, 40, 60, 80, 120),
                        labels = c("0-20", "21-40", "41-60", "61-80", "81+"),
                        right = FALSE)

palette = list(Disease = get_hpa_palettes()$cancers12)

na_search(example_data,
          metadata,
          wide = FALSE,
          metadata_cols = c("Age_bin", "Disease"),
          palette = palette)

#> $na_data
#> # A tibble: 3,600 × 5
#>    Age_bin Disease Categories Assay  NA_percentage
#>    <fct>   <chr>   <chr>      <chr>          <dbl>
#>  1 41-60   AML     41-60_AML  AARSD1             5
#>  2 41-60   AML     41-60_AML  ABL1               5
#>  3 41-60   AML     41-60_AML  ACAA1              5
#>  4 41-60   AML     41-60_AML  ACAN               5
#>  5 41-60   AML     41-60_AML  ACE2               0
#>  6 41-60   AML     41-60_AML  ACOX1              5
#>  7 41-60   AML     41-60_AML  ACP5               0
#>  8 41-60   AML     41-60_AML  ACP6               0
#>  9 41-60   AML     41-60_AML  ACTA2              0
#> 10 41-60   AML     41-60_AML  ACTN4              0
#> # ℹ 3,590 more rows
#>
#> $na_heatmap
#>
