hd_plot_feature_boxplot() plots boxplots for the specified features in the dataset.
It annotates the boxplot with color for the selected case and it is also possible to
add the individual data points on top.
Usage
hd_plot_feature_boxplot(
  dat,
  metadata = NULL,
  variable = "Disease",
  features,
  case,
  type = "case_vs_all",
  points = TRUE,
  x_labels = TRUE,
  yaxis_title = "NPX",
  palette = NULL
)
Arguments
- dat
An HDAnalyzeR object or a dataset in wide format and sample ID as its first column.
- metadata
A dataset containing the metadata information with the sample ID as the first column. If a HDAnalyzeR object is provided, this parameter is not needed.
- variable
The name of the metadata variable containing the case and control groups. Default is "Disease".
- features
The features to include in the boxplot. They should be columns of the data.
- case
The case class.
- type
The type of boxplot to plot. Default is "case_vs_all". Other option is "case_vs_control".
- points
Whether to add points to the boxplot.
- x_labels
Whether to show the x-axis labels.
- yaxis_title
The title of the y-axis. Default is "NPX".
- palette
The color palette for the classes. If it is a character, it should be one of the palettes from
hd_palettes(). Default is NULL.
Examples
# Initialize an HDAnalyzeR object
hd_object <- hd_initialize(example_data, example_metadata)
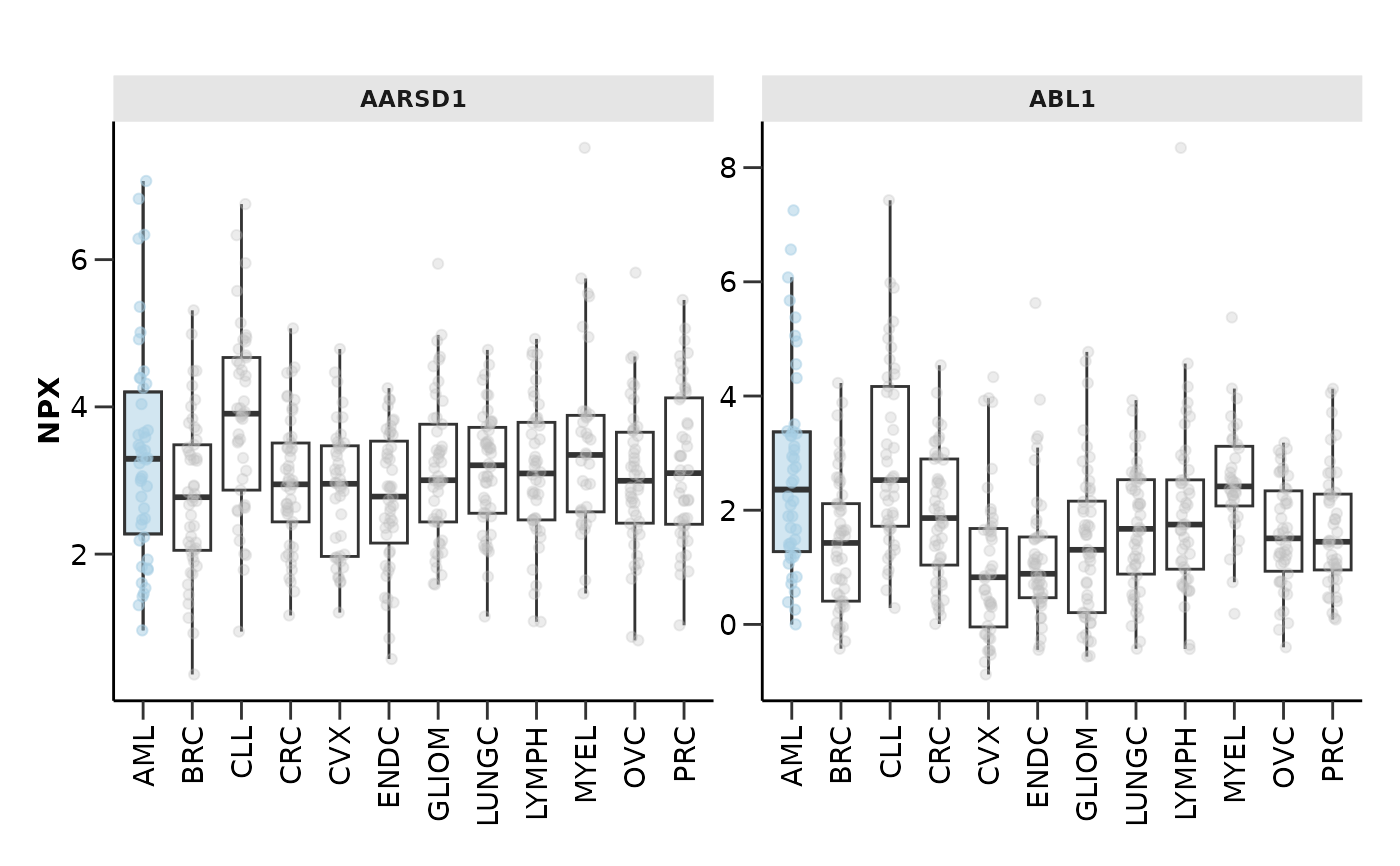
# Boxplots for AARSD1 and ABL1 in AML vs all other classes
hd_plot_feature_boxplot(hd_object,
variable = "Disease",
features = c("AARSD1", "ABL1"),
case = "AML",
palette = "cancers12")
#> Warning: Removed 68 rows containing non-finite outside the scale range
#> (`stat_boxplot()`).
#> Warning: Removed 8 rows containing non-finite outside the scale range
#> (`stat_boxplot()`).
#> Warning: Removed 60 rows containing missing values or values outside the scale range
#> (`geom_point()`).
#> Warning: Removed 8 rows containing missing values or values outside the scale range
#> (`geom_point()`).
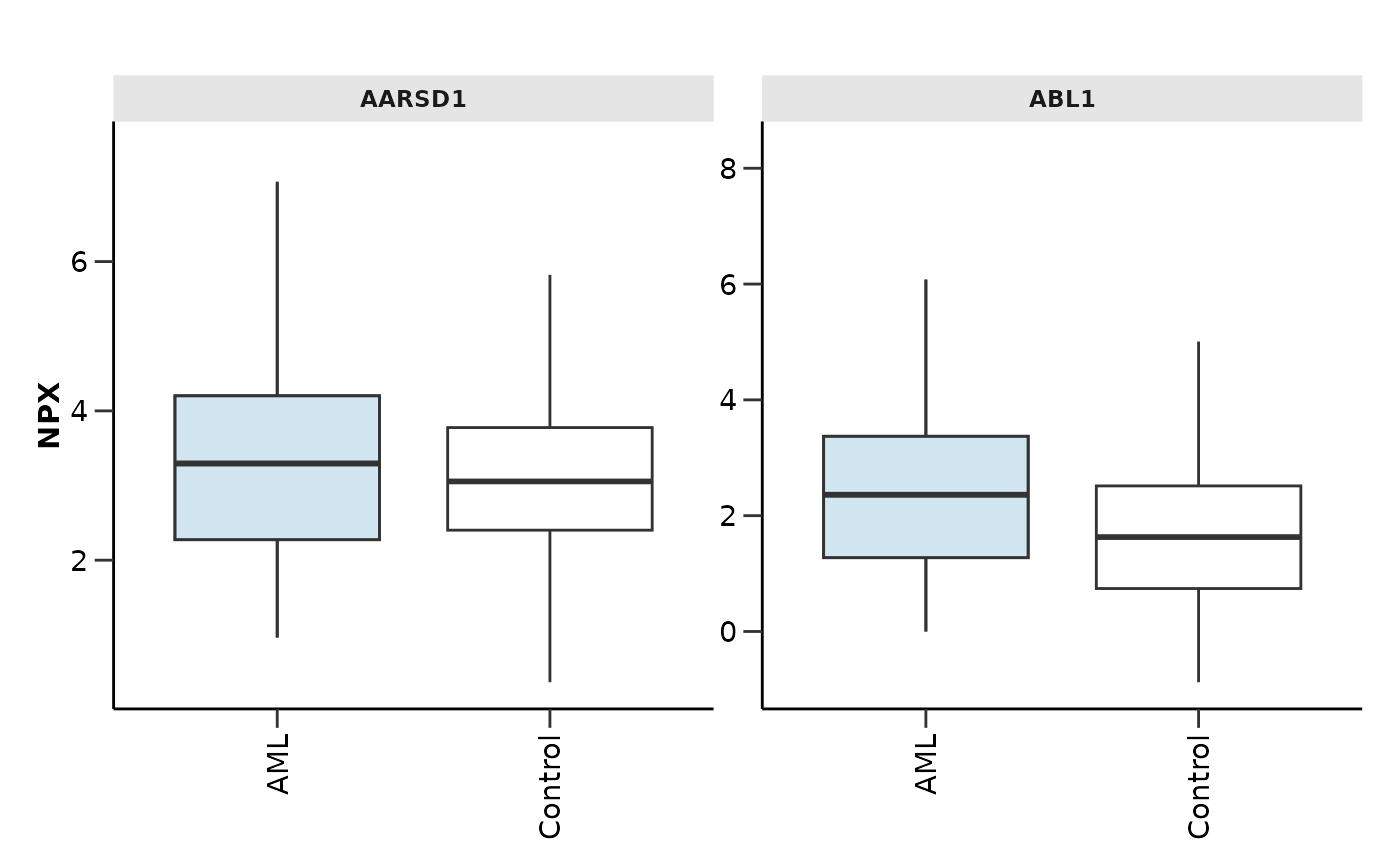
 # Boxplots for AARSD1 and ABL1 in AML vs joint control group
hd_plot_feature_boxplot(hd_object,
variable = "Disease",
features = c("AARSD1", "ABL1"),
case = "AML",
type = "case_vs_control",
palette = "cancers12",
points = FALSE)
#> Warning: Removed 68 rows containing non-finite outside the scale range
#> (`stat_boxplot()`).
#> Warning: Removed 8 rows containing non-finite outside the scale range
#> (`stat_boxplot()`).
# Boxplots for AARSD1 and ABL1 in AML vs joint control group
hd_plot_feature_boxplot(hd_object,
variable = "Disease",
features = c("AARSD1", "ABL1"),
case = "AML",
type = "case_vs_control",
palette = "cancers12",
points = FALSE)
#> Warning: Removed 68 rows containing non-finite outside the scale range
#> (`stat_boxplot()`).
#> Warning: Removed 8 rows containing non-finite outside the scale range
#> (`stat_boxplot()`).