do_rf() runs the random forest classification model pipeline. It splits the
data into training and test sets, creates class-balanced case-control groups,
and fits the model. It also performs hyperparameter optimization, fits the best
model, tests it, and plots useful the feature variable importance.
Usage
do_rf(
  olink_data,
  metadata,
  variable = "Disease",
  case,
  control,
  wide = TRUE,
  strata = TRUE,
  balance_groups = TRUE,
  only_female = NULL,
  only_male = NULL,
  exclude_cols = "Sex",
  ratio = 0.75,
  cor_threshold = 0.9,
  normalize = TRUE,
  cv_sets = 5,
  grid_size = 10,
  ncores = 4,
  hypopt_vis = TRUE,
  palette = NULL,
  vline = TRUE,
  subtitle = c("accuracy", "sensitivity", "specificity", "auc", "features",
    "top-features"),
  varimp_yaxis_names = FALSE,
  nfeatures = 9,
  points = TRUE,
  boxplot_xaxis_names = FALSE,
  seed = 123
)
Arguments
- olink_data
Olink data.
- metadata
Metadata.
- variable
The variable to predict. Default is "Disease".
- case
The case group.
- control
The control groups.
- wide
Whether the data is wide format. Default is TRUE.
- strata
Whether to stratify the data. Default is TRUE.
- balance_groups
Whether to balance the groups. Default is TRUE.
- only_female
Vector of diseases that are female specific. Default is NULL.
- only_male
Vector of diseases that are male specific. Default is NULL.
- exclude_cols
Columns to exclude from the data before the model is tuned. Default is "Sex".
- ratio
Ratio of training data to test data. Default is 0.75.
- cor_threshold
Threshold of absolute correlation values. This will be used to remove the minimum number of features so that all their resulting absolute correlations are less than this value.
- normalize
Whether to normalize numeric data to have a standard deviation of one and a mean of zero. Default is TRUE.
- cv_sets
Number of cross-validation sets. Default is 5.
- grid_size
Size of the hyperparameter optimization grid. Default is 10.
- ncores
Number of cores to use for parallel processing. Default is 4.
- hypopt_vis
Whether to visualize hyperparameter optimization results. Default is TRUE.
- palette
The color palette for the plot. If it is a character, it should be one of the palettes from
get_hpa_palettes(). Default is NULL.- vline
Whether to add a vertical line at 50% importance. Default is TRUE.
- subtitle
Vector of subtitle elements to include in the plot. Default is a list with all.
- varimp_yaxis_names
Whether to add y-axis names to the plot. Default is FALSE.
- nfeatures
Number of top features to include in the boxplot. Default is 9.
- points
Whether to add points to the boxplot. Default is TRUE.
- boxplot_xaxis_names
Whether to add x-axis names to the boxplot. Default is FALSE.
- seed
Seed for reproducibility. Default is 123.
Value
A list with results for each disease. The list contains:
hypopt_res: Hyperparameter optimization results.
finalfit_res: Final model fitting results.
testfit_res: Test model fitting results.
var_imp_res: Variable importance results.
Details
If the data contain missing values, KNN imputation will be applied.
If no check for feature correlation is preferred, set cor_threshold to 1.
Examples
do_rf(example_data,
example_metadata,
case = "AML",
control = c("CLL", "MYEL"),
balance_groups = TRUE,
wide = FALSE,
palette = "cancers12",
cv_sets = 5,
grid_size = 10,
ncores = 1)
#> Joining with `by = join_by(DAid)`
#> Sets and groups are ready. Model fitting is starting...
#> Classification model for AML as case is starting...
#> $hypopt_res
#> $hypopt_res$rf_tune
#> # Tuning results
#> # 5-fold cross-validation using stratification
#> # A tibble: 5 × 5
#> splits id .metrics .notes .predictions
#> <list> <chr> <list> <list> <list>
#> 1 <split [59/16]> Fold1 <tibble [10 × 6]> <tibble [0 × 3]> <tibble [160 × 7]>
#> 2 <split [59/16]> Fold2 <tibble [10 × 6]> <tibble [0 × 3]> <tibble [160 × 7]>
#> 3 <split [60/15]> Fold3 <tibble [10 × 6]> <tibble [0 × 3]> <tibble [150 × 7]>
#> 4 <split [61/14]> Fold4 <tibble [10 × 6]> <tibble [0 × 3]> <tibble [140 × 7]>
#> 5 <split [61/14]> Fold5 <tibble [10 × 6]> <tibble [0 × 3]> <tibble [140 × 7]>
#>
#> $hypopt_res$rf_wf
#> ══ Workflow ════════════════════════════════════════════════════════════════════
#> Preprocessor: Recipe
#> Model: rand_forest()
#>
#> ── Preprocessor ────────────────────────────────────────────────────────────────
#> 4 Recipe Steps
#>
#> • step_normalize()
#> • step_nzv()
#> • step_corr()
#> • step_impute_knn()
#>
#> ── Model ───────────────────────────────────────────────────────────────────────
#> Random Forest Model Specification (classification)
#>
#> Main Arguments:
#> mtry = tune::tune()
#> trees = 1000
#> min_n = tune::tune()
#>
#> Engine-Specific Arguments:
#> importance = permutation
#>
#> Computational engine: ranger
#>
#>
#> $hypopt_res$train_set
#> # A tibble: 75 × 102
#> DAid AARSD1 ABL1 ACAA1 ACAN ACE2 ACOX1 ACP5 ACP6 ACTA2
#> <chr> <dbl> <dbl> <dbl> <dbl> <dbl> <dbl> <dbl> <dbl> <dbl>
#> 1 DA00003 NA NA NA 0.989 NA 0.330 1.37 NA NA
#> 2 DA00004 3.41 3.38 1.69 NA 1.52 NA 0.841 0.582 1.70
#> 3 DA00005 5.01 5.05 0.128 0.401 -0.933 -0.584 0.0265 1.16 2.73
#> 4 DA00007 NA NA 3.96 0.682 3.14 2.62 1.47 2.25 2.01
#> 5 DA00008 2.78 0.812 -0.552 0.982 -0.101 -0.304 0.376 -0.826 1.52
#> 6 DA00009 4.39 3.34 -0.452 -0.868 0.395 1.71 1.49 -0.0285 0.200
#> 7 DA00010 1.83 1.21 -0.912 -1.04 -0.0918 -0.304 1.69 0.0920 2.04
#> 8 DA00011 3.48 4.96 3.50 -0.338 4.48 1.26 2.18 1.62 1.79
#> 9 DA00012 4.31 0.710 -1.44 -0.218 -0.469 -0.361 -0.0714 -1.30 2.86
#> 10 DA00013 1.31 2.52 1.11 0.997 4.56 -1.35 0.833 2.33 3.57
#> # ℹ 65 more rows
#> # ℹ 92 more variables: ACTN4 <dbl>, ACY1 <dbl>, ADA <dbl>, ADA2 <dbl>,
#> # ADAM15 <dbl>, ADAM23 <dbl>, ADAM8 <dbl>, ADAMTS13 <dbl>, ADAMTS15 <dbl>,
#> # ADAMTS16 <dbl>, ADAMTS8 <dbl>, ADCYAP1R1 <dbl>, ADGRE2 <dbl>, ADGRE5 <dbl>,
#> # ADGRG1 <dbl>, ADGRG2 <dbl>, ADH4 <dbl>, ADM <dbl>, AGER <dbl>, AGR2 <dbl>,
#> # AGR3 <dbl>, AGRN <dbl>, AGRP <dbl>, AGXT <dbl>, AHCY <dbl>, AHSP <dbl>,
#> # AIF1 <dbl>, AIFM1 <dbl>, AK1 <dbl>, AKR1B1 <dbl>, AKR1C4 <dbl>, …
#>
#> $hypopt_res$test_set
#> # A tibble: 27 × 102
#> DAid AARSD1 ABL1 ACAA1 ACAN ACE2 ACOX1 ACP5 ACP6 ACTA2
#> <chr> <dbl> <dbl> <dbl> <dbl> <dbl> <dbl> <dbl> <dbl> <dbl>
#> 1 DA00001 3.39 2.76 1.71 0.0333 1.76 -0.919 1.54 2.15 2.81
#> 2 DA00002 1.42 1.25 -0.816 -0.459 0.826 -0.902 0.647 1.30 0.798
#> 3 DA00006 6.83 1.18 -1.74 -0.156 1.53 -0.721 0.620 0.527 0.772
#> 4 DA00016 1.79 1.36 0.106 -0.372 3.40 -1.19 1.77 1.07 2.00
#> 5 DA00022 7.07 5.67 3.68 -0.458 3.09 0.690 0.649 2.17 1.83
#> 6 DA00023 2.92 -0.0000706 0.602 1.59 0.198 1.61 0.283 2.35 2.11
#> 7 DA00034 3.45 2.91 1.31 0.423 0.647 1.40 0.691 0.720 1.95
#> 8 DA00035 4.39 3.31 0.454 0.290 2.68 0.116 -1.32 0.945 2.14
#> 9 DA00038 2.23 1.42 0.484 1.72 1.46 0.0747 1.82 0.109 4.27
#> 10 DA00039 4.26 0.572 -1.97 -0.433 0.208 0.790 -0.236 1.52 0.652
#> # ℹ 17 more rows
#> # ℹ 92 more variables: ACTN4 <dbl>, ACY1 <dbl>, ADA <dbl>, ADA2 <dbl>,
#> # ADAM15 <dbl>, ADAM23 <dbl>, ADAM8 <dbl>, ADAMTS13 <dbl>, ADAMTS15 <dbl>,
#> # ADAMTS16 <dbl>, ADAMTS8 <dbl>, ADCYAP1R1 <dbl>, ADGRE2 <dbl>, ADGRE5 <dbl>,
#> # ADGRG1 <dbl>, ADGRG2 <dbl>, ADH4 <dbl>, ADM <dbl>, AGER <dbl>, AGR2 <dbl>,
#> # AGR3 <dbl>, AGRN <dbl>, AGRP <dbl>, AGXT <dbl>, AHCY <dbl>, AHSP <dbl>,
#> # AIF1 <dbl>, AIFM1 <dbl>, AK1 <dbl>, AKR1B1 <dbl>, AKR1C4 <dbl>, …
#>
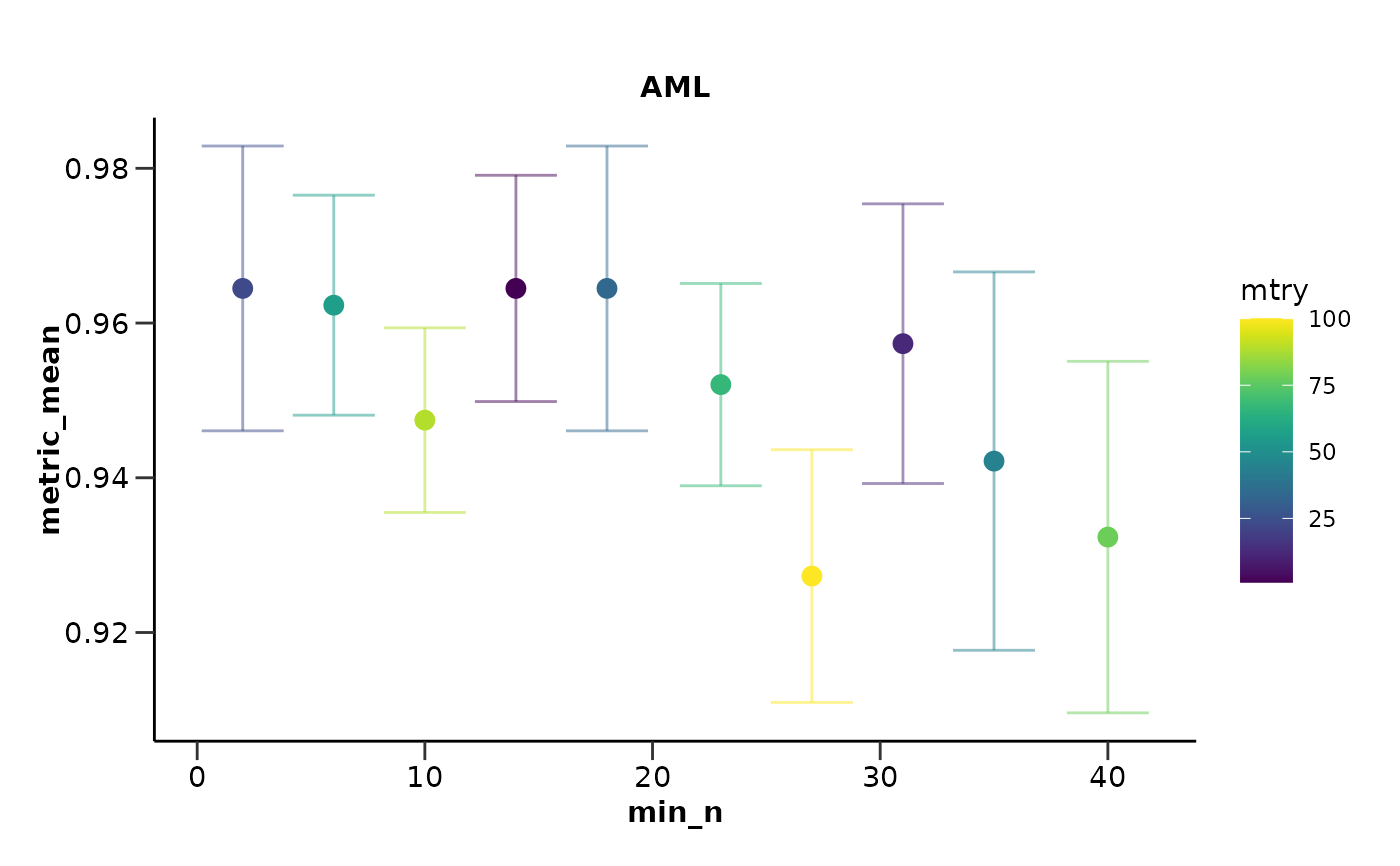
#> $hypopt_res$hypopt_vis
 #>
#>
#> $finalfit_res
#> $finalfit_res$final
#> ══ Workflow [trained] ══════════════════════════════════════════════════════════
#> Preprocessor: Recipe
#> Model: rand_forest()
#>
#> ── Preprocessor ────────────────────────────────────────────────────────────────
#> 4 Recipe Steps
#>
#> • step_normalize()
#> • step_nzv()
#> • step_corr()
#> • step_impute_knn()
#>
#> ── Model ───────────────────────────────────────────────────────────────────────
#> Ranger result
#>
#> Call:
#> ranger::ranger(x = maybe_data_frame(x), y = y, mtry = min_cols(~1L, x), num.trees = ~1000, min.node.size = min_rows(~14L, x), importance = ~"permutation", num.threads = 1, verbose = FALSE, seed = sample.int(10^5, 1), probability = TRUE)
#>
#> Type: Probability estimation
#> Number of trees: 1000
#> Sample size: 75
#> Number of independent variables: 100
#> Mtry: 1
#> Target node size: 14
#> Variable importance mode: permutation
#> Splitrule: gini
#> OOB prediction error (Brier s.): 0.1716771
#>
#> $finalfit_res$best
#> # A tibble: 1 × 2
#> mtry min_n
#> <int> <int>
#> 1 1 14
#>
#> $finalfit_res$final_wf
#> ══ Workflow ════════════════════════════════════════════════════════════════════
#> Preprocessor: Recipe
#> Model: rand_forest()
#>
#> ── Preprocessor ────────────────────────────────────────────────────────────────
#> 4 Recipe Steps
#>
#> • step_normalize()
#> • step_nzv()
#> • step_corr()
#> • step_impute_knn()
#>
#> ── Model ───────────────────────────────────────────────────────────────────────
#> Random Forest Model Specification (classification)
#>
#> Main Arguments:
#> mtry = 1
#> trees = 1000
#> min_n = 14
#>
#> Engine-Specific Arguments:
#> importance = permutation
#>
#> Computational engine: ranger
#>
#>
#>
#> $testfit_res
#> $testfit_res$metrics
#> $testfit_res$metrics$accuracy
#> [1] 0.74
#>
#> $testfit_res$metrics$sensitivity
#> [1] 0.57
#>
#> $testfit_res$metrics$specificity
#> [1] 0.92
#>
#> $testfit_res$metrics$auc
#> [1] 0.84
#>
#> $testfit_res$metrics$conf_matrix
#> Truth
#> Prediction 0 1
#> 0 8 1
#> 1 6 12
#>
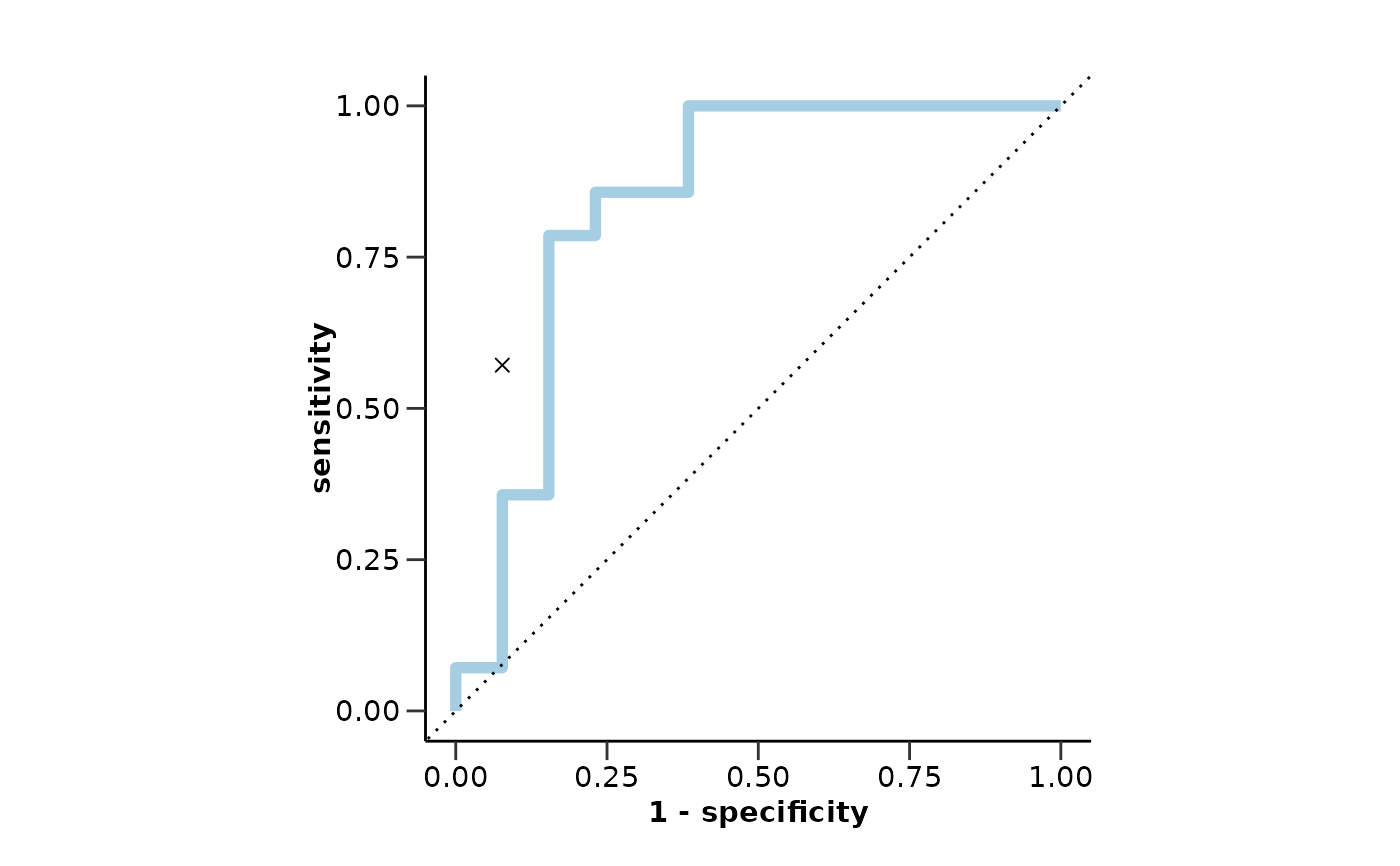
#> $testfit_res$metrics$roc_curve
#>
#>
#> $finalfit_res
#> $finalfit_res$final
#> ══ Workflow [trained] ══════════════════════════════════════════════════════════
#> Preprocessor: Recipe
#> Model: rand_forest()
#>
#> ── Preprocessor ────────────────────────────────────────────────────────────────
#> 4 Recipe Steps
#>
#> • step_normalize()
#> • step_nzv()
#> • step_corr()
#> • step_impute_knn()
#>
#> ── Model ───────────────────────────────────────────────────────────────────────
#> Ranger result
#>
#> Call:
#> ranger::ranger(x = maybe_data_frame(x), y = y, mtry = min_cols(~1L, x), num.trees = ~1000, min.node.size = min_rows(~14L, x), importance = ~"permutation", num.threads = 1, verbose = FALSE, seed = sample.int(10^5, 1), probability = TRUE)
#>
#> Type: Probability estimation
#> Number of trees: 1000
#> Sample size: 75
#> Number of independent variables: 100
#> Mtry: 1
#> Target node size: 14
#> Variable importance mode: permutation
#> Splitrule: gini
#> OOB prediction error (Brier s.): 0.1716771
#>
#> $finalfit_res$best
#> # A tibble: 1 × 2
#> mtry min_n
#> <int> <int>
#> 1 1 14
#>
#> $finalfit_res$final_wf
#> ══ Workflow ════════════════════════════════════════════════════════════════════
#> Preprocessor: Recipe
#> Model: rand_forest()
#>
#> ── Preprocessor ────────────────────────────────────────────────────────────────
#> 4 Recipe Steps
#>
#> • step_normalize()
#> • step_nzv()
#> • step_corr()
#> • step_impute_knn()
#>
#> ── Model ───────────────────────────────────────────────────────────────────────
#> Random Forest Model Specification (classification)
#>
#> Main Arguments:
#> mtry = 1
#> trees = 1000
#> min_n = 14
#>
#> Engine-Specific Arguments:
#> importance = permutation
#>
#> Computational engine: ranger
#>
#>
#>
#> $testfit_res
#> $testfit_res$metrics
#> $testfit_res$metrics$accuracy
#> [1] 0.74
#>
#> $testfit_res$metrics$sensitivity
#> [1] 0.57
#>
#> $testfit_res$metrics$specificity
#> [1] 0.92
#>
#> $testfit_res$metrics$auc
#> [1] 0.84
#>
#> $testfit_res$metrics$conf_matrix
#> Truth
#> Prediction 0 1
#> 0 8 1
#> 1 6 12
#>
#> $testfit_res$metrics$roc_curve
 #>
#>
#> $testfit_res$mixture
#> [1] NA
#>
#>
#> $var_imp_res
#> $var_imp_res$features
#> # A tibble: 99 × 3
#> Variable Importance Scaled_Importance
#> <fct> <dbl> <dbl>
#> 1 AZU1 0.00700 100
#> 2 ADA 0.00631 90.1
#> 3 ANGPT2 0.00446 63.7
#> 4 AMY2B 0.00410 58.6
#> 5 AGR2 0.00366 52.2
#> 6 ATOX1 0.00351 50.1
#> 7 ACAN 0.00275 39.2
#> 8 ACP6 0.00267 38.2
#> 9 ADAM8 0.00261 37.2
#> 10 APBB1IP 0.00252 35.9
#> # ℹ 89 more rows
#>
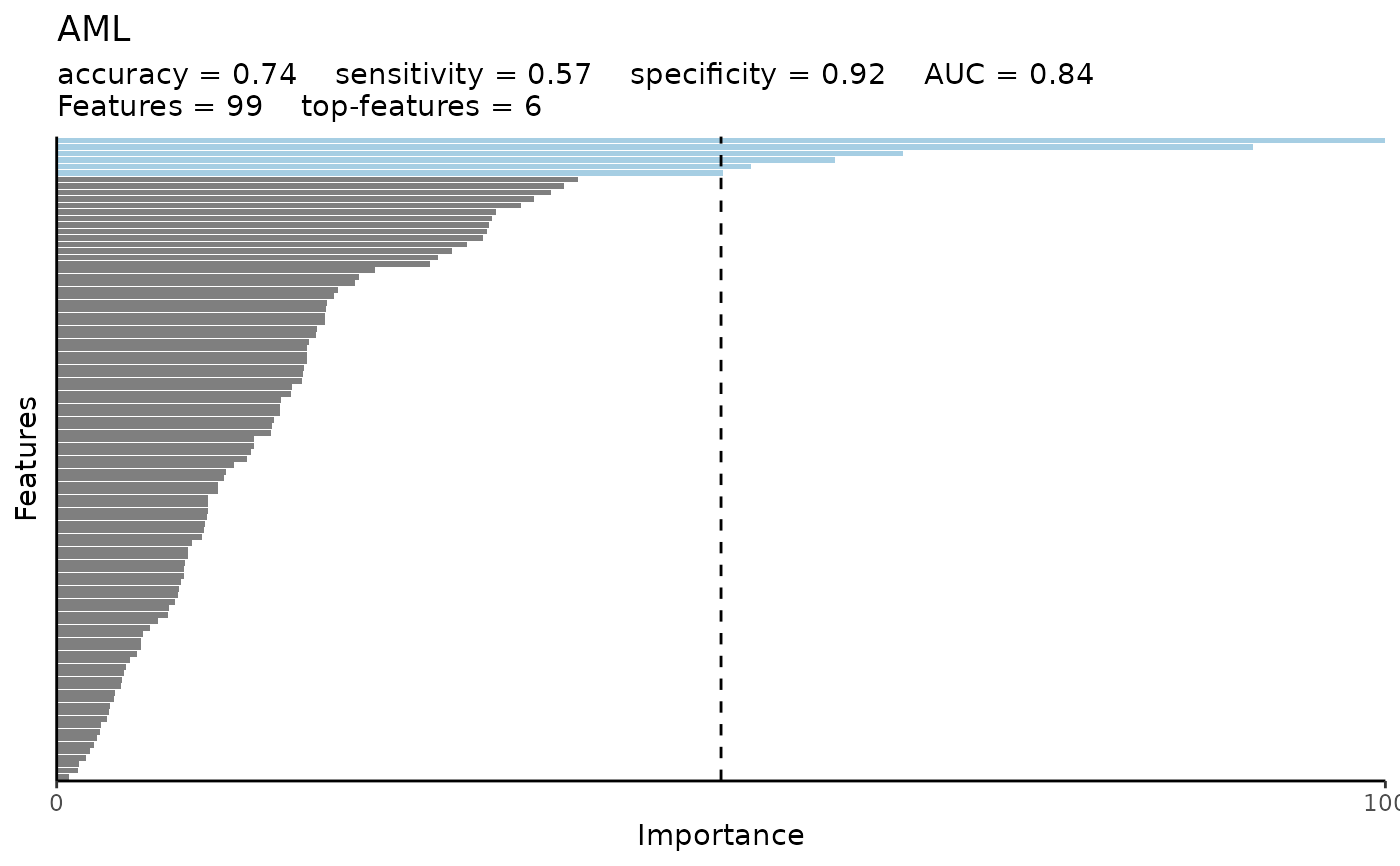
#> $var_imp_res$var_imp_plot
#>
#>
#> $testfit_res$mixture
#> [1] NA
#>
#>
#> $var_imp_res
#> $var_imp_res$features
#> # A tibble: 99 × 3
#> Variable Importance Scaled_Importance
#> <fct> <dbl> <dbl>
#> 1 AZU1 0.00700 100
#> 2 ADA 0.00631 90.1
#> 3 ANGPT2 0.00446 63.7
#> 4 AMY2B 0.00410 58.6
#> 5 AGR2 0.00366 52.2
#> 6 ATOX1 0.00351 50.1
#> 7 ACAN 0.00275 39.2
#> 8 ACP6 0.00267 38.2
#> 9 ADAM8 0.00261 37.2
#> 10 APBB1IP 0.00252 35.9
#> # ℹ 89 more rows
#>
#> $var_imp_res$var_imp_plot
 #>
#>
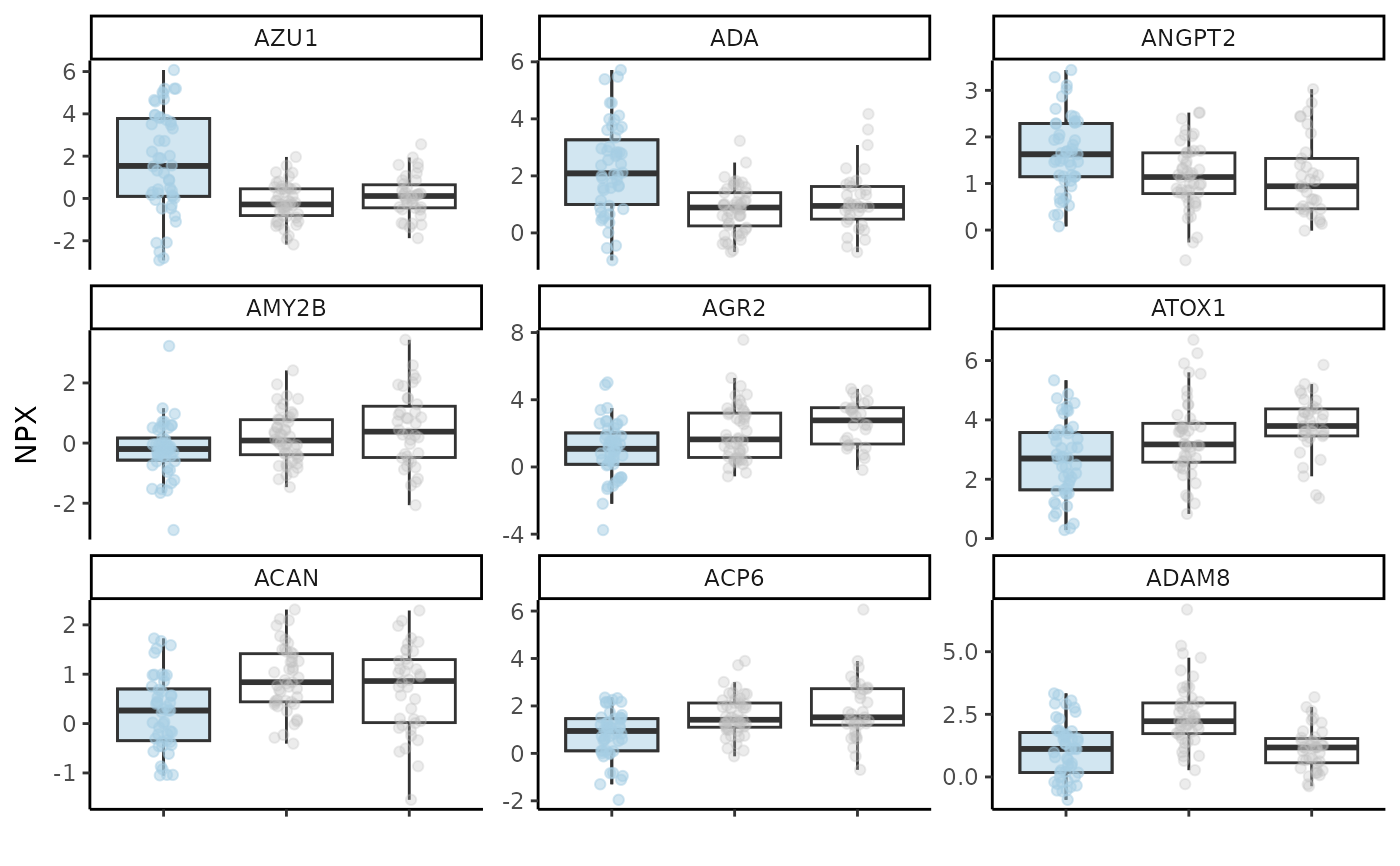
#> $boxplot_res
#> Warning: Removed 45 rows containing non-finite outside the scale range
#> (`stat_boxplot()`).
#> Warning: Removed 8 rows containing non-finite outside the scale range
#> (`stat_boxplot()`).
#> Warning: Removed 37 rows containing missing values or values outside the scale range
#> (`geom_point()`).
#> Warning: Removed 8 rows containing missing values or values outside the scale range
#> (`geom_point()`).
#>
#>
#> $boxplot_res
#> Warning: Removed 45 rows containing non-finite outside the scale range
#> (`stat_boxplot()`).
#> Warning: Removed 8 rows containing non-finite outside the scale range
#> (`stat_boxplot()`).
#> Warning: Removed 37 rows containing missing values or values outside the scale range
#> (`geom_point()`).
#> Warning: Removed 8 rows containing missing values or values outside the scale range
#> (`geom_point()`).
 #>
#>
