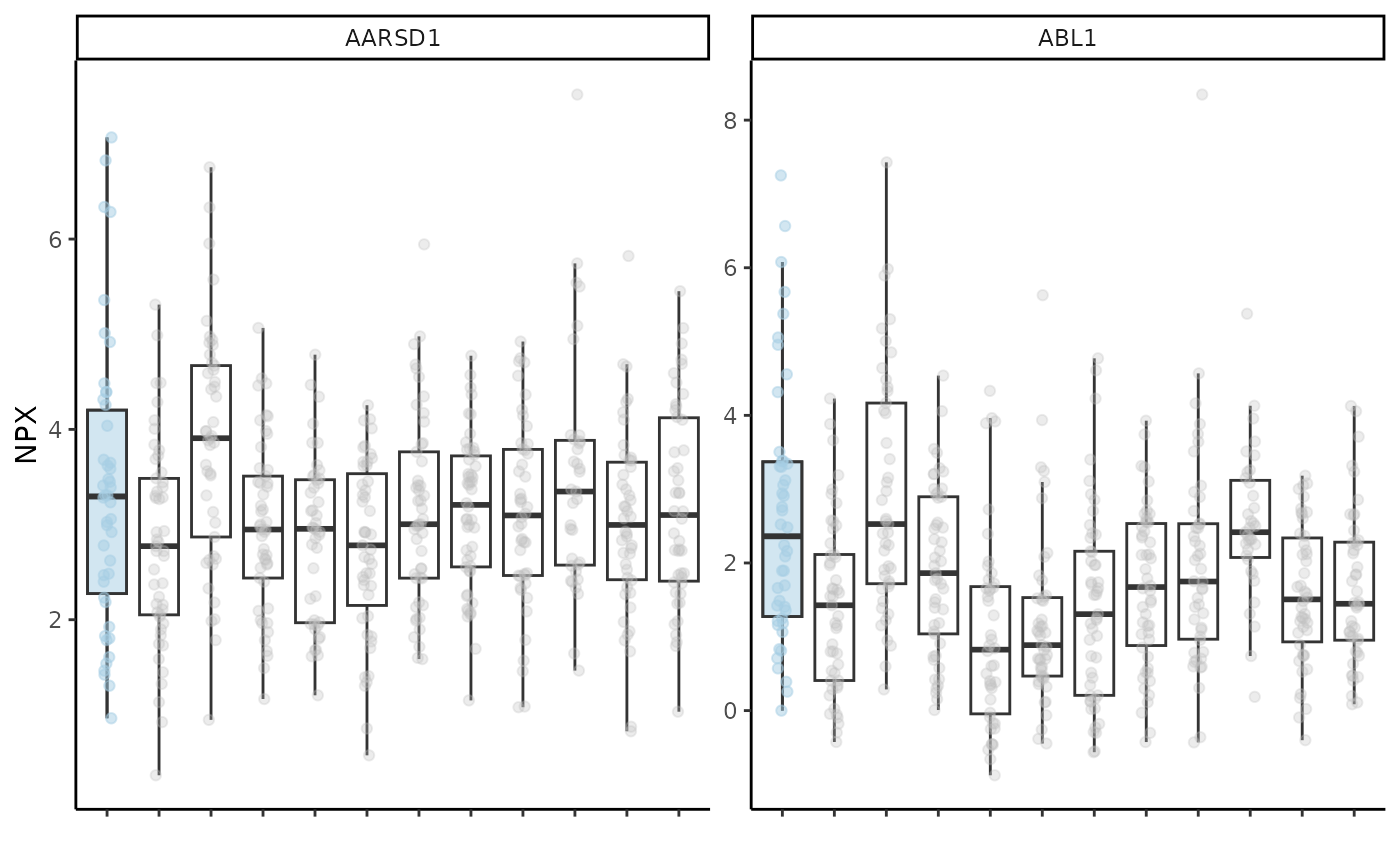
plot_protein_boxplot() plots boxplots for the specified proteins in the dataset.
It annotates the boxplot with color for the selected case
It is also possible to add points to the boxplot.
Usage
plot_protein_boxplot(
  join_data,
  variable = "Disease",
  proteins,
  case,
  points = TRUE,
  xaxis_names = FALSE,
  palette = NULL
)
Arguments
- join_data
The dataset with the wide Olink data joined with the metadata.
- variable
The variable that will be used as
xandfill.- proteins
The proteins to include in the boxplot.
- case
The case to annotate.
- points
Whether to add points to the boxplot.
- xaxis_names
Whether to show the x-axis names. Default is FALSE.
- palette
The color palette to use. Default is "red3" for the annotated case
Examples
# Prepare the data
wide_data <- widen_data(example_data)
join_data <- wide_data |>
  dplyr::left_join(example_metadata |> dplyr::select(DAid, Disease, Sex))
#> Joining with `by = join_by(DAid)`

# Boxplots for AARSD1 and ABL1 in AML
plot_protein_boxplot(join_data,
                     proteins = c("AARSD1", "ABL1"),
                     case = "AML",
                     palette = "cancers12")
#> Warning: Removed 68 rows containing non-finite outside the scale range
#> (`stat_boxplot()`).
#> Warning: Removed 8 rows containing non-finite outside the scale range
#> (`stat_boxplot()`).
#> Warning: Removed 60 rows containing missing values or values outside the scale range
#> (`geom_point()`).
#> Warning: Removed 8 rows containing missing values or values outside the scale range
#> (`geom_point()`).

