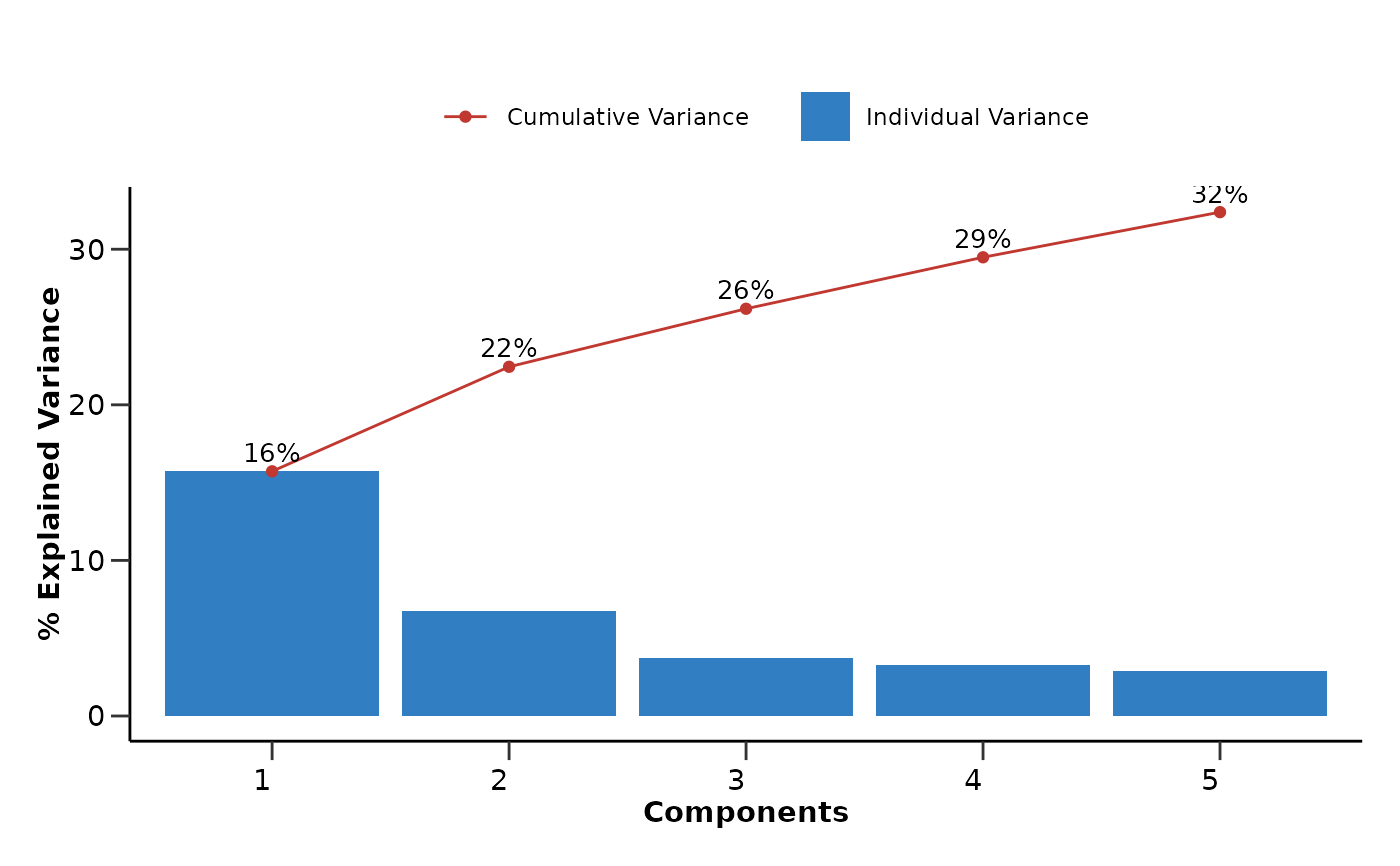
hd_plot_pca_variance() plots the explained variance and cumulative explained variance of the PCs.
Arguments
- pca_object
A PCA object containing the PCA variance. Created by
hd_pca().
Examples
# Create the HDAnalyzeR object providing the data and metadata
hd_object <- hd_initialize(example_data, example_metadata)

# Run the PCA analysis and create the variance plot
pca_object <- hd_pca(hd_object, components = 5, by_sample = TRUE, seed = 123) |>
  hd_plot_pca_variance()
pca_object$pca_variance_plot