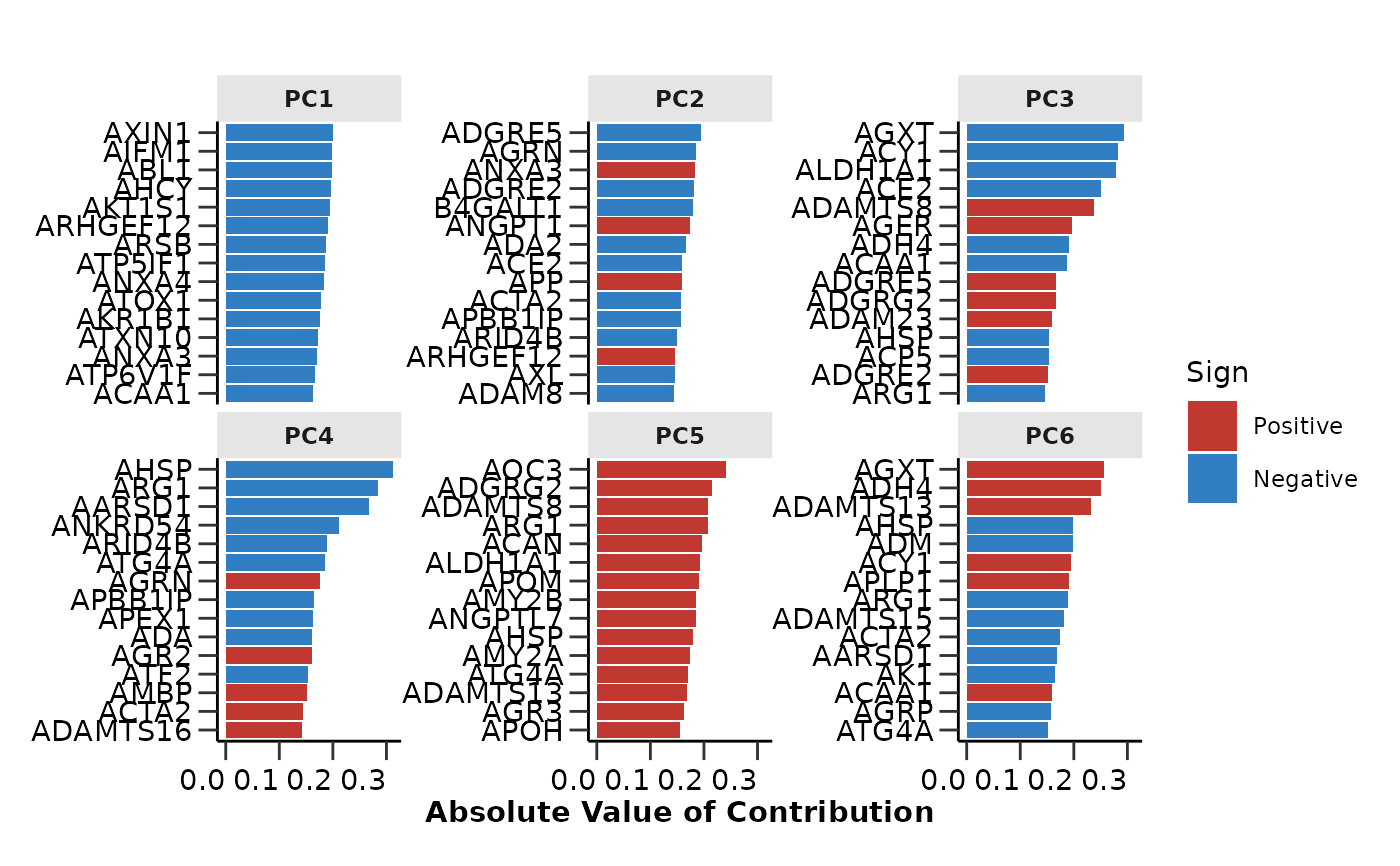
hd_plot_pca_loadings() plots the PCA loadings for the top n features and first m PCs.
n and m are defined by the user. The contribution direction of the features
is indicated by the color of the bars.
Arguments
- pca_object
A PCA object containing the PCA loadings. Created by
hd_pca().- displayed_pcs
The number of PCs to be displayed. Default is 6.
- displayed_features
The number of features to be displayed. Default is 15.
Examples
# Create the HDAnalyzeR object providing the data and metadata
hd_object <- hd_initialize(example_data, example_metadata)

# Run the PCA analysis and create the loadings plot
pca_object <- hd_pca(hd_object, components = 5, by_sample = TRUE, seed = 123) |>
  hd_plot_pca_loadings()

pca_object$pca_loadings_plot